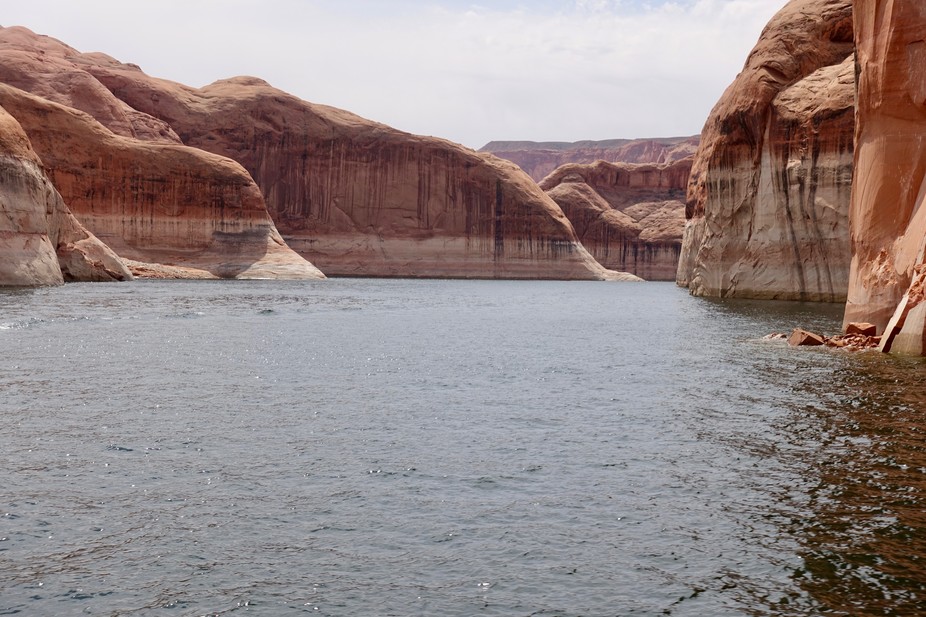
Featured image: Lake Powell, photographed April 12, 2017. The white ‘bathtub ring’ at the cliff base indicates how much higher the lake reached at its peak, nearly 100 feet above the current level. Patti Weeks
The nation’s two largest reservoirs, Lake Mead on the Arizona/Nevada border and Lake Powell on the Arizona/Utah border, were brim full in the year 2000. Four short years later, they had lost enough water to supply California its legally apportioned share of Colorado River water for more than five years. Now, 17 years later, they still have not recovered.
This ongoing, unprecedented event threatens water supplies to Los Angeles, San Diego, Phoenix, Tucson, Denver, Salt Lake City, Albuquerque and some of the most productive agricultural lands anywhere in the world. It is critical to understand what is causing it so water managers can make realistic water use and conservation plans.
While overuse has played a part, a significant portion of the reservoir decline is due to an ongoing drought, which started in 2000 and has led to substantial reductions in river flows. Most droughts are caused by a lack of precipitation. However, our published research shows that about one-third of the flow decline was likely due to higher temperatures in the Colorado River’s Upper Basin, which result from climate change.
This distinction matters because climate change is causing long-term warming that will continue for centuries. As the current “hot drought” shows, climate change-induced warming has the potential to make all droughts more serious, turning what would have been modest droughts into severe ones, and severe ones into unprecedented ones.
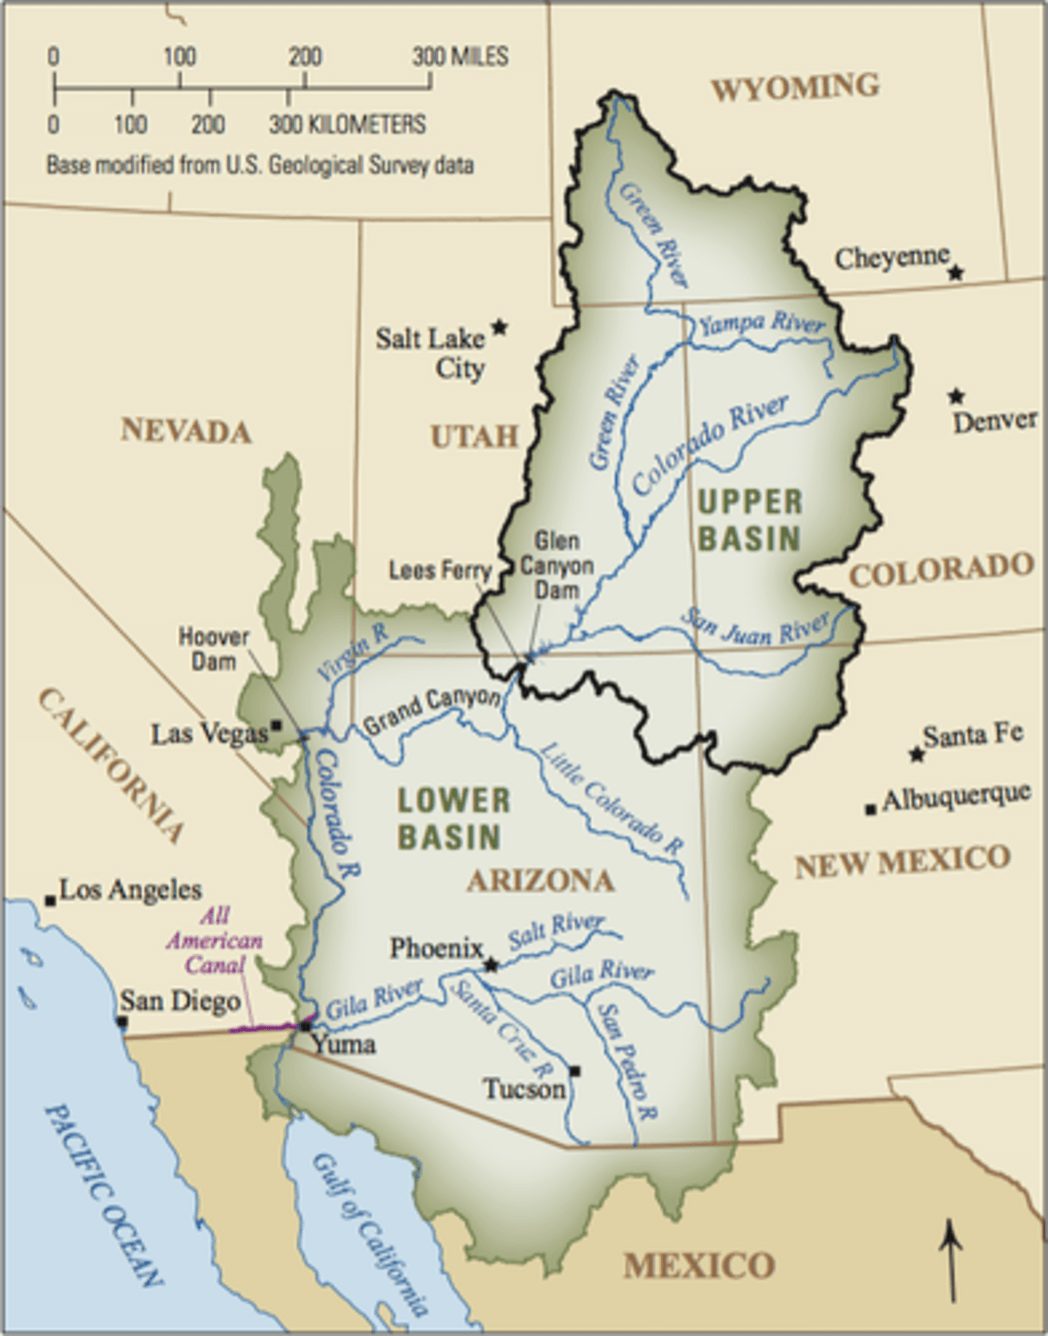
The Colorado River is about 1,400 miles long and flows through seven U.S. states and into Mexico. The Upper Colorado River Basin supplies approximately 90 percent of the water for the entire basin. It originates as rain and snow in the Rocky and Wasatch mountains. USGS
How climate change reduces river flow
In our study, we found the period from 2000 to 2014 is the worst 15-year drought since 1906, when official flow measurements began. During these years, annual flows in the Colorado River averaged 19 percent below the 20th-century average.
During a similar 15-year drought in the 1950s, annual flows declined by 18 percent. But during that drought, the region was drier: rainfall decreased by about 6 percent, compared to 4.5 percent between 2000 and 2014. Why, then, is the recent drought the most severe on record?
The answer is simple: higher temperatures. From 2000 to 2014, temperatures in the Upper Basin, where most of the runoff that feeds the Colorado River is produced, were 1.6 degrees Fahrenheit higher than the 20th-century average. This is why we call this event a hot drought. High temperatures continued in 2015 and 2016, as did less-than-average flows. Runoff in 2017 is expected to be above average, but this will only modestly improve reservoir volumes.
High temperatures affect river levels in many ways. Coupled with earlier snow melt, they lead to a longer growing season, which means more days of water demand from plants. Higher temperatures also increase daily plant water use and evaporation from water bodies and soils. In sum, as it warms, the atmosphere draws more water, up to 4 percent more per degree Fahrenheit from all available sources, so less water flows into the river. These findings also apply to all semi-arid rivers in the American Southwest, especially the Rio Grande.
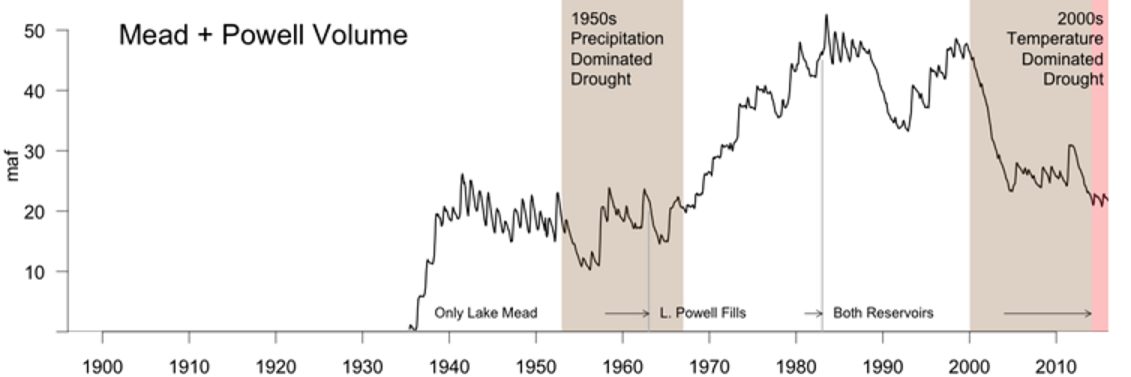
The combined contents of the nation’s two largest reservoirs, Lake Mead and Lake Powell, since their initial fillings. The large decline since 2000 is shaded brown for 2000-2014, our 15-year study period, and pink for the continuing drought in 2015-2016. The loss was significantly influenced by record-setting temperatures, unlike a similar 15-year drought in the 1950s which was driven by a lack of precipitation. Bradley Udall, Author provided
A hotter, drier future
Knowing the relationship between warming and river flow, we can project how the Colorado will be affected by future climate change. Temperature projections from climate models are robust scientific findings based on well-tested physics. In the Colorado River Basin, temperatures are projected to warm by 5°F, compared to the 20th-century average, by midcentury in scenarios that assume either modest or high greenhouse gas emissions. By the end of this century, the region would be 9.5°F warmer if global greenhouse gas emissions are not reduced.
Using simple but strong relationships derived from hydrology models, which were buttressed by observations, we and our colleagues calculated how river flows are affected by higher temperatures. We found that Colorado River flows decline by about 4 percent per degree Fahrenheit increase, which is roughly the same amount as the increased atmospheric water vapor holding capacity discussed above. Thus, warming could reduce water flow in the Colorado by 20 percent or more below the 20th-century average by midcentury, and by as much as 40 percent by the end of the century. Emission reductions could ease the magnitude of warming by 2100 from 9.5°F to 6.5°F, which would reduce river flow by approximately 25 percent.
Large precipitation increases could counteract the declines that these all-but-certain future temperature increases will cause. But for that to happen, precipitation would have to increase by an average of 8 percent at midcentury and 15 percent by 2100.
The American Canal carries water from the Colorado River to farms in California’s Imperial Valley. Adam Dubrowa, FEMA/Wikipedia
On a year-in, year-out basis, these large increases would be substantial. The largest decade-long increases in precipitation in the 20th century were 8 percent. When such an increase occurred over 10 years in the Colorado Basin in the 1980s, it caused large-scale flooding that threatened the structural stability of Glen Canyon Dam, due to a spillway failure not unlike the recent collapse at California’s Oroville Dam.
For several reasons, we think these large precipitation increases will not occur. The Colorado River Basin and other areas around the globe at essentially the same latitudes, such as the Mediterranean region and areas of Chile, South Africa and Australia, are especially at risk for drying because they lie immediately poleward of the planet’s major deserts. These deserts are projected to stretch polewards as the climate warms. In the Colorado River basin, dry areas to the south are expected to encroach on some of the basin’s most productive snow and runoff areas.
Moreover, climate models do not agree on whether future precipitation in the Colorado Basin will increase or decrease, let alone by how much. Rain gauge measurements indicate that there has not been any significant long-term change in precipitation in the Upper Basin of the Colorado since 1896, which makes substantial increases in the future even more doubtful.
Megadroughts, which last anywhere from 20 to 50 years or more, provide yet another reason to avoid putting too much faith in precipitation increases. We know from tree-ring studies going back to A.D. 800 that megadroughts have occurred previously in the basin.
March of 2017 was the warmest March in Colorado history, with temperatures a stunning 8.8°F above normal. Snowpack and expected runoff declined substantially in the face of this record warmth. Clearly, climate change in the Colorado River Basin is here, it is serious and it requires multiple responses.
It takes years to implement new water agreements, so states, cities and major water users should start to plan now for significant temperature-induced flow declines. With the Southwest’s ample renewable energy resources and low costs for producing solar power, we can also lead the way in reducing greenhouse gas emissions, inducing other regions to do the same. Failing to act on climate change means accepting the very high risk that the Colorado River Basin will continue to dry up into the future.
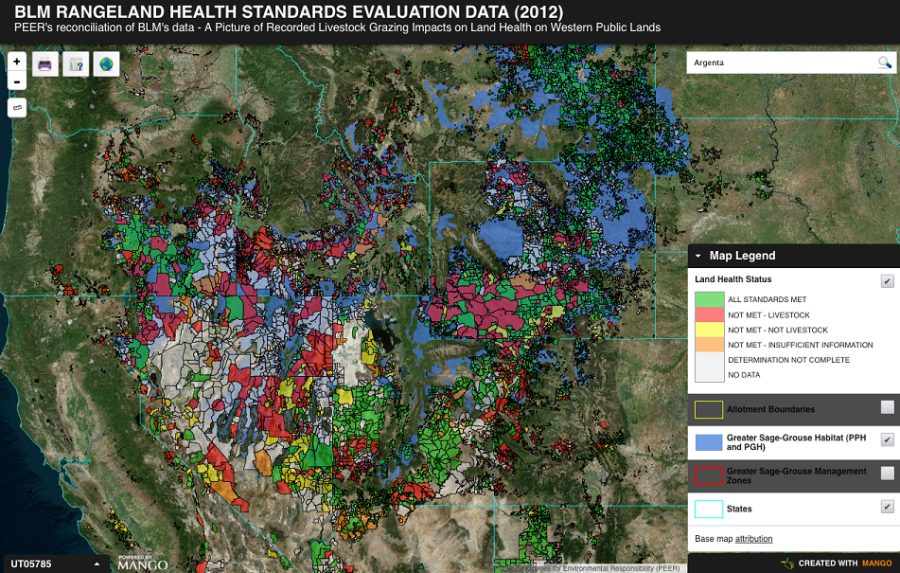
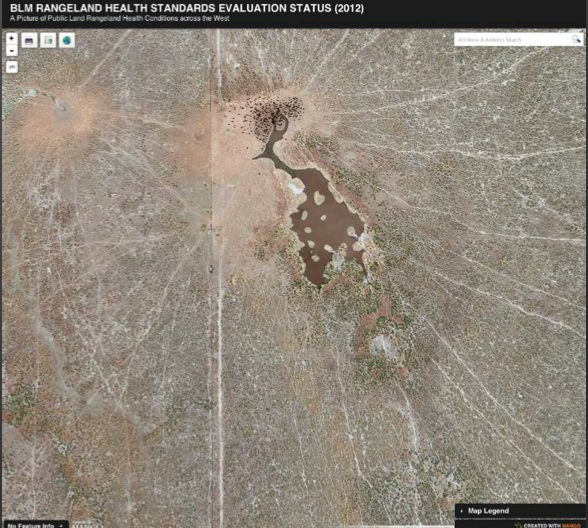
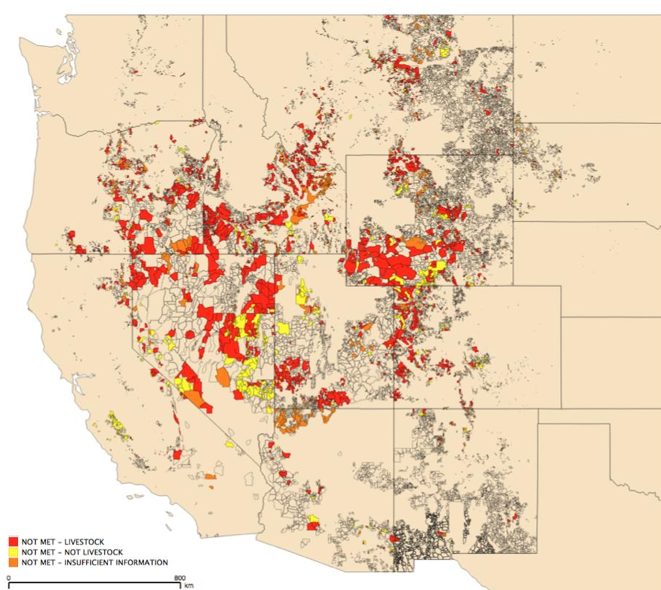
Featured image: The map includes blue-tinted areas that represent Greater sage grouse habitat, underneath the tens of thousands of tinted grazing allotments. Image by High Country News.
When the Bureau of Land Management ordered the removal of cattle from public rangeland this summer near Battle Mountain, Nevada, the state was in its third year of severe drought. Conditions were too dry to sustain the number of cattle that were grazing there, the BLM contended. Locals responded in part by announcing a “Cowboy Express” ride from Bodega Bay, California to Washington, DC to protest federal overreach and to demand that local District Manager Doug Furtado be ousted.
Disagreements like the one in Battle Mountain are hardly novel in Western politics. But this week, a new tool to understand livestock impact on public lands was thrown into the mix. Washington, DC-based non-profit Public Employees for Environmental Responsibility (PEER) released an interactive map that collates over 45,000BLMrecords that diagnose 20,000 allotments. The map is seven years in the making, the result of Freedom of Information Act requests PEER and Western Watersheds Project put to the BLM.
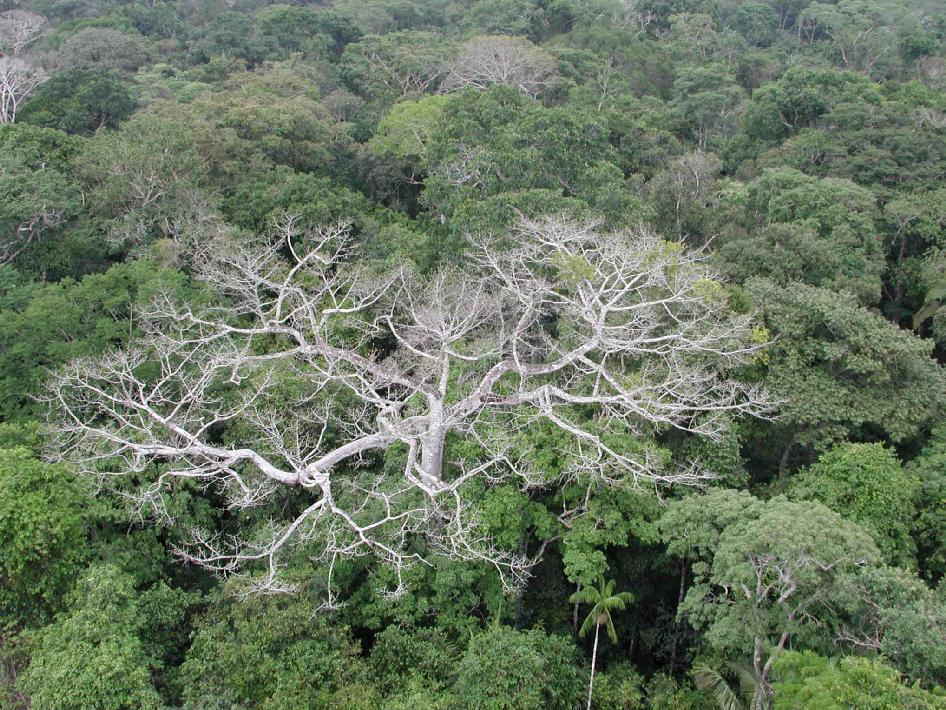
An area of the Amazon rainforest twice the size of California continues to suffer from the effects of a megadrought that began in 2005, finds a new NASA-led study. These results, together with observed recurrences of droughts every few years and associated damage to the forests in southern and western Amazonia in the past decade, suggest these rainforests may be showing the first signs of potential large-scale degradation due to climate change.
An international research team led by Sassan Saatchi of NASA’s Jet Propulsion Laboratory, Pasadena, Calif., analyzed more than a decade of satellite microwave radar data collected between 2000 and 2009 over Amazonia. The observations included measurements of rainfall from NASA’s Tropical Rainfall Measuring Mission and measurements of the moisture content and structure of the forest canopy (top layer) from the Seawinds scatterometer on NASA’s QuikScat spacecraft.
The scientists found that during the summer of 2005, more than 270,000 square miles (700,000 square kilometers, or 70 million hectares) of pristine, old-growth forest in southwestern Amazonia experienced an extensive, severe drought. This megadrought caused widespread changes to the forest canopy that were detectable by satellite. The changes suggest dieback of branches and tree falls, especially among the older, larger, more vulnerable canopy trees that blanket the forest.
While rainfall levels gradually recovered in subsequent years, the damage to the forest canopy persisted all the way to the next major drought, which began in 2010. About half the forest affected by the 2005 drought – an area the size of California – did not recover by the time QuikScat stopped gathering global data in November 2009 and before the start of a more extensive drought in 2010.
“The biggest surprise for us was that the effects appeared to persist for years after the 2005 drought,” said study co-author Yadvinder Malhi of the University of Oxford, United Kingdom. “We had expected the forest canopy to bounce back after a year with a new flush of leaf growth, but the damage appeared to persist right up to the subsequent drought in 2010.”
Recent Amazonian droughts have drawn attention to the vulnerability of tropical forests to climate change. Satellite and ground data have shown an increase in wildfires during drought years and tree die-offs following severe droughts. Until now, there had been no satellite-based assessment of the multi-year impacts of these droughts across all of Amazonia. Large-scale droughts can lead to sustained releases of carbon dioxide from decaying wood, affecting ecosystems and Earth’s carbon cycle.
The researchers attribute the 2005 Amazonian drought to the long-term warming of tropical Atlantic sea surface temperatures. “In effect, the same climate phenomenon that helped form hurricanes Katrina and Rita along U.S. southern coasts in 2005 also likely caused the severe drought in southwest Amazonia,” Saatchi said. “An extreme climate event caused the drought, which subsequently damaged the Amazonian trees.”
Saatchi said such megadroughts can have long-lasting effects on rainforest ecosystems. “Our results suggest that if droughts continue at five- to 10-year intervals or increase in frequency due to climate change, large areas of the Amazon forest are likely to be exposed to persistent effects of droughts and corresponding slow forest recovery,” he said. “This may alter the structure and function of Amazonian rainforest ecosystems.”
The team found that the area affected by the 2005 drought was much larger than scientists had previously predicted. About 30 percent (656,370 square miles, or 1.7 million square kilometers) of the Amazon basin’s total current forest area was affected, with more than five percent of the forest experiencing severe drought conditions. The 2010 drought affected nearly half of the entire Amazon forest, with nearly a fifth of it experiencing severe drought. More than 231,660 square miles (600,000 square kilometers) of the area affected by the 2005 drought were also affected by the 2010 drought. This “double whammy” by successive droughts suggests a potentially long-lasting and widespread effect on forests in southern and western Amazonia.
The drought rate in Amazonia during the past decade is unprecedented over the past century. In addition to the two major droughts in 2005 and 2010, the area has experienced several localized mini-droughts in recent years. Observations from ground stations show that rainfall over the southern Amazon rainforest declined by almost 3.2 percent per year in the period from 1970 to 1998. Climate analyses for the period from 1995 to 2005 show a steady decline in water availability for plants in the region. Together, these data suggest a decade of moderate water stress led up to the 2005 drought, helping trigger the large-scale forest damage seen following the 2005 drought.
Saatchi said the new study sheds new light on a major controversy that existed about how the Amazon forest responded following the 2005 megadrought. Previous studies using conventional optical satellite data produced contradictory results, likely due to the difficulty of correcting the optical data for interference by clouds and other atmospheric conditions.
In contrast, QuikScat’s scatterometer radar was able to see through the clouds and penetrate into the top few meters of vegetation, providing daily measurements of the forest canopy structure and estimates of how much water the forest contains. Areas of drought-damaged forest produced a lower radar signal than the signals collected over healthy forest areas, indicating either that the forest canopy is drier or it is less “rough” due to damage to or the death of canopy trees.
The numbers are in: 2012, the year of a surreal March heat wave, a severe drought in the corn belt and a massive storm that caused broad devastation in the mid-Atlantic states, turns out to have been the hottest year ever recorded in the contiguous United States.
How hot was it? The temperature differences between years are usually measured in fractions of a degree, but last year blew away the previous record, set in 1998, by a full degree Fahrenheit.
If that does not sound sufficiently impressive, consider that 34,008 new daily high records were set at weather stations across the country, compared with only 6,664 new record lows, according to a count maintained by the Weather Channel meteorologist Guy Walton, using federal temperature records.
That ratio, which was roughly in balance as recently as the 1970s, has been out of whack for decades as the country has warmed, but never by as much as it was last year.
“The heat was remarkable,” said Jake Crouch, a scientist with the National Climatic Data Center in Asheville, N.C., which released the official climate compilation on Tuesday. “It was prolonged. That we beat the record by one degree is quite a big deal.”
Scientists said that natural variability almost certainly played a role in last year’s extreme heat and drought. But many of them expressed doubt that such a striking new record would have been set without the backdrop of global warming caused by the human release of greenhouse gases. And they warned that 2012 was likely a foretaste of things to come, as continuing warming makes heat extremes more likely.
Even so, the last year’s record for the United States is not expected to translate into a global temperature record when figures are released in coming weeks. The year featured a La Niña weather pattern, which tends to cool the global climate over all, and scientists expect it to be the world’s eighth or ninth warmest year on record.
Assuming that prediction holds up, it will mean that the 10 warmest years on record all fell within the past 15 years, a measure of how much the planet has warmed. Nobody who is under 28 has lived through a month of global temperatures that fell below the 20th-century average, because the last such month was February 1985.
Last year’s weather in the United States began with an unusually warm winter, with relatively little snow across much of the country, followed by a March that was so hot that trees burst into bloom and swimming pools opened early. The soil dried out in the March heat, helping to set the stage for a drought that peaked during the warmest July on record.
The drought engulfed 61 percent of the nation, killed corn and soybean crops and sent prices spiraling. It was comparable to a severe drought in the 1950s, Mr. Crouch said, but not quite as severe as the legendary Dust Bowl drought of the 1930s, which was exacerbated by poor farming practices that allowed topsoil to blow away.
Extensive records covering the lower 48 states go back to 1895; Alaska and Hawaii have shorter records and are generally not included in long-term climate comparisons for that reason.
Mr. Crouch pointed out that until last year, the coldest year in the historical record for the lower 48 states, 1917, was separated from the warmest year, 1998, by only 4.2 degrees Fahrenheit. That is why the 2012 record, and its one degree increase over 1998, strikes climatologists as so unusual.
“We’re taking quite a large step above what the period of record has shown for the contiguous United States,” he said.
In addition to being the nation’s warmest year, 2012 turned out to be the second-worst on a measure called the Climate Extremes Index, surpassed only by 1998.
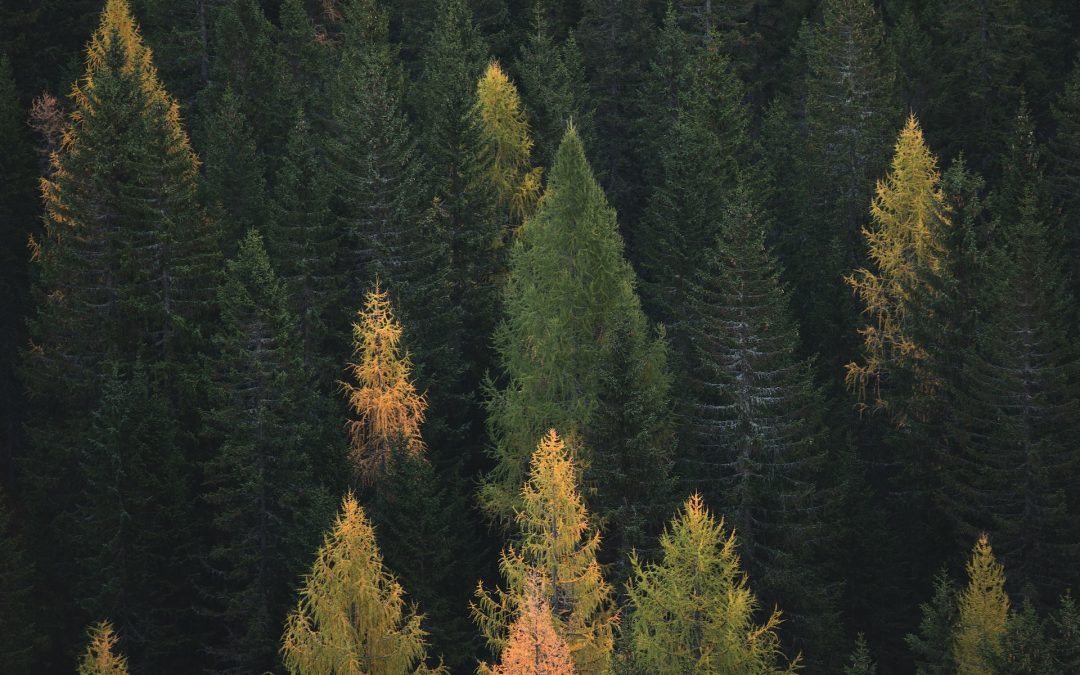
Already facing an onslaught of threats from logging and conversion for agriculture, forests worldwide are increasingly impacted by the effects of climate change, including drought, heightened fire risk, and disease, putting the ecological services they afford in jeopardy, warns a new paper published in the journal Nature Climate Change.
The study, authored by William Anderegg of Carnegie Institution for Science at Stanford University and Jeffrey Kane and Leander Anderegg of Northern Arizona University, reviews dozens of scientific papers dealing with the ecological impacts of climate change. They find widespread cases of forest die-off from drought and elevated temperatures, which can increase the incidence of fire and pest infestations like pine beetles. These effects have the potential to trigger transitions to other ecosystems, including scrubland and savanna. But the impacts vary from forest to forest and the authors say more research is needed to fully understand the effects of climate change on forest ecosystems.
However it is not only forests that are affected by climate change — they themselves impact climate. Forests store 45 percent of the carbon found in terrestrial ecosystems and sequester as much as 25 percent of annual carbon emissions from human activities, helping mitigate a key driver of climate change. Yet they also raise local temperate by absorbing sunlight. Clearing forests in polar regions has the paradoxical effect of increasing the reflectivity of Earth’s surface, reducing local temperatures. Yet clear-cutting of forests in the tropics accounts for 8-15 percent of anthropogenic greenhouse gas emissions.
The authors say that the research gaps make it difficult to forecast the economic and ecological impacts of climate change on forests, which cover cover some 42 million square kilometers or 30 percent of Earth’s land surface and underpin hundreds of billions to trillions of dollars a year in economic activity.
“The varied nature of the consequences of forest mortality means that we need a multidisciplinary approach going forward, including ecologists, biogeochemists, hydrologists, economists, social scientists, and climate scientists,” said William Anderegg in a statement. “A better understanding of forest die-off in response to climate change can inform forest management, business decisions, and policy.”