Shutterstock/Bernhard Staehli
James Dyke, University of Exeter; Robert Watson, University of East Anglia, and Wolfgang Knorr, Lund University
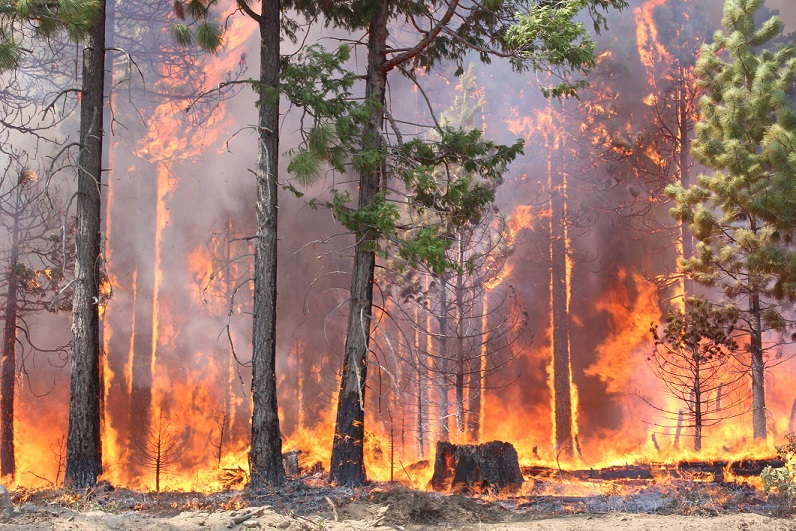
Record breaking fossil fuel production, all time high greenhouse gas emissions and extreme temperatures. Like the proverbial frog in the heating pan of water, we refuse to respond to the climate and ecological crisis with any sense of urgency. Under such circumstances, claims from some that global warming can still be limited to no more than 1.5°C take on a surreal quality.
For example, at the start of 2023’s international climate negotiations in Dubai, conference president, Sultan Al Jaber, boldly stated that 1.5°C was his goal and that his presidency would be guided by a “deep sense of urgency” to limit global temperatures to 1.5°C. He made such lofty promises while planning a massive increase in oil and gas production as CEO of the Abu Dhabi National Oil Company.
We should not be surprised to see such behaviour from the head of a fossil fuel company. But Al Jaber is not an outlier. Scratch at the surface of almost any net zero pledge or policy that claims to be aligned with the 1.5°C goal of the landmark 2015 Paris agreement and you will reveal the same sort of reasoning: we can avoid dangerous climate change without actually doing what this demands – which is to rapidly reduce greenhouse gas emissions from industry, transport, energy (70% of total) and food systems (30% of total), while ramping up energy efficiency.
A particularly instructive example is Amazon. In 2019 the company established a 2040 net zero target which was then verified by the UN Science Based Targets initiative (SBTi) which has been leading the charge in getting companies to establish climate targets compatible with the Paris agreement. But over the next four years Amazon’s emissions went up by 40%. Given this dismal performance, the SBTi was forced to act and removed Amazon and over 200 companies from its Corporate Net Zero Standard.
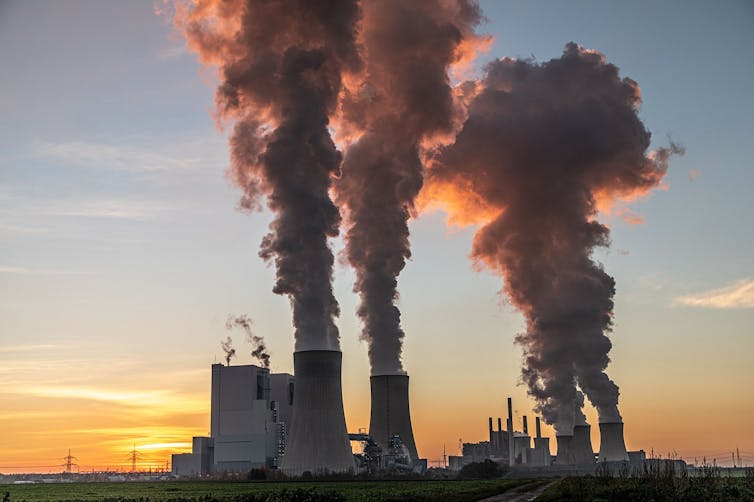
This is also not surprising given that net zero and even the Paris agreement have been built around the perceived need to keep burning fossil fuels, at least in the short term. Not do so would threaten economic growth, given that fossil fuels still supply over 80% of total global energy. The trillions of dollars of fossil fuel assets at risk with rapid decarbonisation have also served as powerful brakes on climate action.
Overshoot
The way to understand this doublethink: that we can avoid dangerous climate change while continuing to burn fossil fuels – is that it relies on the concept of overshoot. The promise is that we can overshoot past any amount of warming, with the deployment of planetary-scale carbon dioxide removal dragging temperatures back down by the end of the century.
This not only cripples any attempt to limit warming to 1.5°C, but risks catastrophic levels of climate change as it locks us in to energy and material-intensive solutions which for the most part exist only on paper.
To argue that we can safely overshoot 1.5°C, or any amount of warming, is saying the quiet bit out loud: we simply don’t care about the increasing amount of suffering and deaths that will be caused while the recovery is worked on.
This article is part of Conversation Insights.
Our co-editors commission long-form journalism, working with academics from many different backgrounds who are engaged in projects aimed at tackling societal and scientific challenges.
A key element of overshoot is carbon dioxide removal. This is essentially a time machine – we are told we can turn back the clock of decades of delay by sucking carbon dioxide directly out of the atmosphere. We don’t need rapid decarbonisation now, because in the future we will be able to take back those carbon emissions. If or when that doesn’t work, we are led to believe that even more outlandish geoengineering approaches such as spraying sulphurous compounds into the high atmosphere in an attempt to block out sunlight – which amounts to planetary refrigeration – will save us.
The 2015 Paris agreement was an astonishing accomplishment. The establishment of 1.5°C as being the internationally agreed ceiling for warming was a success for those people and nations most exposed to climate change hazards. We know that every fraction of a degree matters. But at the time, believing warming could really be limited to well below 2°C required a leap of faith when it came to nations and companies putting their shoulder to the wheel of decarbonisation. What has happened instead is that the net zero approach of Paris is becoming detached from reality as it is increasingly relying on science fiction levels of speculative technology.
There is arguably an even bigger problem with the Paris agreement. By framing climate change in terms of temperature, it focuses on the symptoms, not the cause. 1.5°C or any amount of warming is the result of humans changing the energy balance of the climate by increasing the amount of carbon dioxide in the atmosphere. This traps more heat. Changes in the global average temperature is the established way of measuring this increase in heat, but no one experiences this average.
Climate change is dangerous because of weather that affects particular places at particular times. Simply put, this extra heat is making weather more unstable. Unfortunately, having temperature targets makes solar geoengineering seem like a sensible approach because it may lower temperatures. But it does this by not reducing, but increasing our interference in the climate system. Trying to block out the sun in response to increasing carbon emissions is like turning on the air conditioning in response to a house fire.
In 2021 we argued that net zero was a dangerous trap. Three years on and we can see the jaws of this trap beginning to close, with climate policy being increasingly framed in terms of overshoot. The resulting impacts on food and water security, poverty, human health, the destruction of biodiversity and ecosystems will produce intolerable suffering.
The situation demands honesty, and a change of course. If this does not materialise then things are likely to deteriorate, potentially rapidly and in ways that may be impossible to control.
Au revoir Paris
The time has come to accept that climate policy has failed, and that the 2015 landmark Paris agreement is dead. We let it die by pretending that we could both continue to burn fossil fuels and avoid dangerous climate change at the same time. Rather than demand the immediate phase out of fossil fuels, the Paris agreement proposed 22nd-century temperature targets which could be met by balancing the sources and sinks of carbon. Within that ambiguity net zero flourished. And yet apart from the COVID economic shock in 2020, emissions have increased every year since 2015, reaching an all time high in 2023.
Despite there being abundant evidence that climate action makes good economic sense (the cost of inaction vastly exceeds the cost of action), no country strengthened their pledges at the last three COPs (the annual UN international meetings) even though it was clear that the world was on course to sail past 2°C, let alone 1.5°C. The Paris agreement should be producing a 50% reduction in greenhouse gas emissions by 2030, but current policies mean that they are on track to be higher than they are today.
Catazul/Pixabay, CC BY
Editor’s note: DGR knows that “renewable” technologies are not sustainable and that the only transition will be to a future that does not include civilization.
We do not deny that significant progress has been made with renewable technologies. Rates of deployment of wind and solar have increased each year for the past 22 years and carbon emissions are going down in some of the richest nations, including the UK and the US. But this is not happening fast enough. A central element of the Paris agreement is that richer nations need to lead decarbonisation efforts to give lower income nations more time to transition away from fossil fuels. Despite some claims to the contrary, the global energy transition is not in full swing. In fact, it hasn’t actually begun because the transition demands a reduction in fossil fuel use. Instead it continues to increase year-on-year.
And so policymakers are turning to overshoot in an attempt to claim that they have a plan to avoid dangerous climate change. A central plank of this approach is that the climate system in the future will continue to function as it does today. This is a reckless assumption.
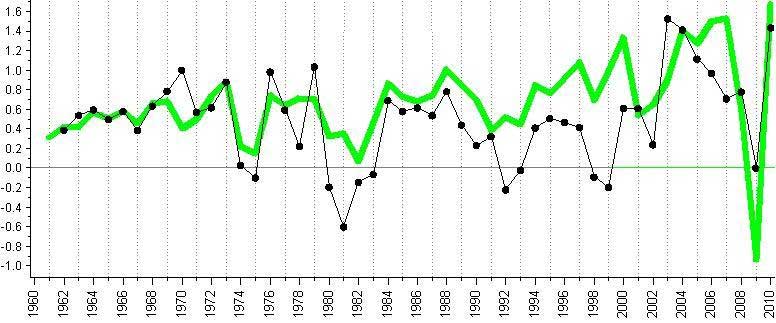
2023’s warning signs
At the start of 2023, Berkeley Earth, NASA, the UK Met Office, and Carbon Brief predicted that 2023 would be slightly warmer than the previous year but unlikely to set any records. Twelve months later and all four organisations concluded that 2023 was by some distance the warmest year ever recorded. In fact, between February 2023 and February 2024 the global average temperature warming exceeded the Paris target of 1.5°C.
The extreme weather events of 2023 give us a glimpse of the suffering that further global warming will produce. A 2024 report from the World Economic Forum concluded that by 2050 climate change may have caused over 14 million deaths and US$12.5 trillion in loss and damages.
Currently we cannot fully explain why global temperatures have been so high for the past 18 months. Changes in dust, soot and other aerosols are important, and there are natural processes such as El Niño that will be having an effect.
But it appears that there is still something missing in our current understanding of how the climate is responding to human impacts. This includes changes in the Earth’s vital natural carbon cycle.
Around half of all the carbon dioxide humans have put into the atmosphere over the whole of human history has gone into “carbon sinks” on land and the oceans. We get this carbon removal “for free”, and without it, warming would be much higher. Carbon dioxide from the air dissolves in the oceans (making them more acidic which threatens marine ecosystems). At the same time, increasing carbon dioxide promotes the growth of plants and trees which locks up carbon in their leaves, roots, trunks.
All climate policies and scenarios assume that these natural carbon sinks will continue to remove tens of billions of tons of carbon from the atmosphere each year. There is evidence that land-based carbon sinks, such as forests, removed significantly less carbon in 2023. If natural sinks begin to fail – something they may well do in a warmer world – then the task of lowering global temperatures becomes even harder. The only credible way of limiting warming to any amount, is to stop putting greenhouse gasses into the atmosphere in the first place.
Science fiction solutions
It’s clear that the commitments countries have made to date as part of the Paris agreement will not keep humanity safe while carbon emissions and temperatures continue to break records. Indeed, proposing to spend trillions of dollars over this century to suck carbon dioxide out of the air, or the myriad other ways to hack the climate is an acknowledgement that the world’s largest polluters are not going to curb the burning of fossil fuels.
Direct Air Capture (DAC), Bio Energy Carbon Capture and Storage (BECCS), enhanced ocean alkalinity, biochar, sulphate aerosol injection, cirrus cloud thinning – the entire wacky races of carbon dioxide removal and geoengineering only makes sense in a world of failed climate policy.

HarmonyCenter/Pixabay, CC BY
Over the following years we are going to see climate impacts increase. Lethal heatwaves are going to become more common. Storms and floods are going to become increasingly destructive. More people are going to be displaced from their homes. National and regional harvests will fail. Vast sums of money will need to be spent on efforts to adapt to climate change, and perhaps even more compensating those who are most affected. We are expected to believe that while all this and more unfolds, new technologies that will directly modify the Earth’s atmosphere and energy balance will be successfully deployed.
What’s more, some of these technologies may need to operate for three hundred years in order for the consequences of overshoot to be avoided. Rather than quickly slow down carbon polluting activities and increasing the chances that the Earth system will recover, we are instead going all in on net zero and overshoot in an increasingly desperate hope that untested science fiction solutions will save us from climate breakdown.
We can see the cliff edge rapidly approaching. Rather than slam on the brakes, some people are instead pushing their foot down harder on the accelerator. Their justification for this insanity is that we need to go faster in order to be able to make the jump and land safely on the other side.
We believe that many who advocate for carbon dioxide removal and geoengineering do so in good faith. But they include proposals to refreeze the Arctic by pumping up sea water onto ice sheets to form new layers of ice and snow. These are interesting ideas to research, but there is very little evidence this will have any effect on the Arctic let alone global climate. These are the sorts of knots that people tie themselves up in when they acknowledge the failure of climate policy, but refuse to challenge the fundamental forces behind such failure. They are unwittingly slowing down the only effective action of rapidly phasing out fossil fuels.
That’s because proposals to remove carbon dioxide from the air or geoengineer the climate promise a recovery from overshoot, a recovery that will be delivered by innovation, driven by growth. That this growth is powered by the same fossil fuels that are causing the problem in the first place doesn’t feature in their analysis.
The bottom line here is that the climate system is utterly indifferent to our pledges and promises. It doesn’t care about economic growth. And if we carry on burning fossil fuels then it will not stop changing until the energy balance is restored. By which time millions of people could be dead, with many more facing intolerable suffering.
Major climate tipping points
Even if we assume that carbon removal and even geoengineering technologies can be deployed in time, there is a very large problem with the plan to overshoot 1.5°C and then lower temperatures later: tipping points.
The science of tipping points is rapidly advancing. Late last year one of us (James Dyke) along with over 200 academics from around the world was involved in the production of the Global Tipping Points Report. This was a review of the latest science about where tipping points in the climate system may be, as well as exploring how social systems can undertake rapid change (in the direction that we want) thereby producing positive tipping points. Within the report’s 350 pages is abundant evidence that the overshoot approach is an extraordinarily dangerous gamble with the future of humanity. Some tipping points have the potential to cause global havoc.
The melt of permafrost could release billions of tons of greenhouse gasses into the atmosphere and supercharge human-caused climate change. Fortunately, this seems unlikely under the current warming. Unfortunately, the chance that ocean currents in the North Atlantic could collapse may be much higher than previously thought. If that were to materialise, weather systems across the world, but in particular in Europe and North America, would be thrown into chaos. Beyond 1.5°C, warm water coral reefs are heading towards annihilation. The latest science concludes that by 2°C global reefs would be reduced by 99%. The devastating bleaching event unfolding across the Great Barrier Reef follows multiple mass mortality events. To say we are witnessing one of the world’s greatest biological wonders die is insufficient. We are knowingly killing it.
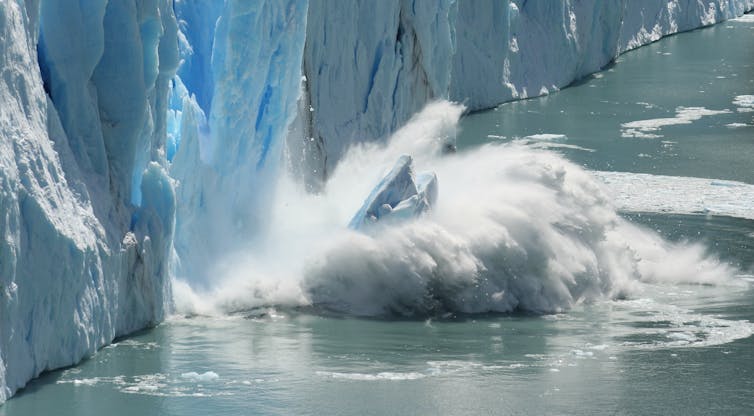
We may have even already passed some major climate tipping points. The Earth has two great ice sheets, Antarctica, and Greenland. Both are disappearing as a consequence of climate change. Between 2016 and 2020, the Greenland ice sheet lost on average 372 billion tons of ice a year. The current best assessment of when a tipping point could be reached for the Greenland ice sheet is around 1.5°C.
This does not mean that the Greenland ice sheet will suddenly collapse if warming exceeds that level. There is so much ice (some 2,800 trillion tons) that it would take centuries for all of it to melt over which time sea levels would rise seven metres. If global temperatures could be brought back down after a tipping point, then maybe the ice sheet could be stabilised. We just cannot say with any certainty that such a recovery would be possible. While we struggle with the science, 30 million tons of ice is melting across Greenland every hour on average.

Pexels from Pixabay, CC BY
The take home message from research on these and other tipping points is that further warming accelerates us towards catastrophe. Important science, but is anyone listening?
It’s five minutes to midnight…again
We know we must urgently act on climate change because we are repeatedly told that time is running out. In 2015, Professor Jeffrey Sachs, the UN special adviser and director of The Earth Institute, declared:
The time has finally arrived – we’ve been talking about these six months for many years but we’re now here. This is certainly our generation’s best chance to get on track.
In 2019 (then) Prince Charles gave a speech in which he said: “I am firmly of the view that the next 18 months will decide our ability to keep climate change to survivable levels and to restore nature to the equilibrium we need for our survival.”
“We have six months to save the planet,” exhorted International Energy Agency head Fatih Birol – one year later in 2020. In April 2024, Simon Stiell, executive secretary of the United Nations Framework Convention on Climate Change said the next two years are “essential in saving our planet”.
Either the climate crisis has a very fortunate feature that allows the countdown to catastrophe to be continually reset, or we are deluding ourselves with endless declarations that time has not quite run out. If you can repeatedly hit snooze on your alarm clock and roll over back to sleep, then your alarm clock is not working.
Or there is another possibility. Stressing that we have very little time to act is intended to focus attention on climate negotiations. It’s part of a wider attempt to not just wake people up to the impending crisis, but generate effective action. This is sometimes used to explain how the 1.5°C threshold of warming came to be agreed. Rather than a specific target, it should be understood as a stretch goal. We may very well fail, but in reaching for it we move much faster than we would have done with a higher target, such as 2°C. For example, consider this statement made in 2018:
Stretching the goal to 1.5 degrees celsius isn’t simply about speeding up. Rather, something else must happen and society needs to find another lever to pull on a global scale.
What could this lever be? New thinking about economics that goes beyond GDP? Serious consideration of how rich industrialised nations could financially and materially help poorer nations to leapfrog fossil fuel infrastructure? Participatory democracy approaches that could help birth the radical new politics needed for the restructuring of our fossil fuel powered societies? None of these.
The lever in question is Carbon Capture and Storage (CCS) because the above quote comes from an article written by Shell in 2018. In this advertorial Shell argues that we will need fossil fuels for many decades to come. CCS allows the promise that we can continue to burn fossil fuels and avoid carbon dioxide pollution by trapping the gas before it leaves the chimney. Back in 2018, Shell was promoting its carbon removal and offsets heavy Sky Scenario, an approach described as “a dangerous fantasy” by leading climate change academics as it assumed massive carbon emissions could be offset by tree planting.
Since then Shell has further funded carbon removal research within UK universities presumably in efforts to burnish its arguments that it must be able to continue to extract vast amounts of oil and gas.
Shell is far from alone in waving carbon capture magic wands. Exxon is making great claims for CCS as a way to produce net zero hydrogen from fossil gas – claims that have been subject to pointed criticism from academics with recent reporting exposing industry wide greenwashing around CCS.
But the rot goes much deeper. All climate policy scenarios that propose to limit warming to near 1.5°C rely on the largely unproven technologies of CCS and BECCS. BECCS sounds like a good idea in theory. Rather than burn coal in a power station, burn biomass such as wood chips. This would initially be a carbon neutral way of generating electricity if you grew as many trees as you cut down and burnt. If you then add scrubbers to the power station chimneys to capture the carbon dioxide, and then bury that carbon deep underground, then you would be able to generate power at the same time as reducing concentrations of carbon dioxide in the atmosphere.
Unfortunately, there is now clear evidence that in practice, large-scale BECCS would have very adverse effects on biodiversity, and food and water security given the large amounts of land that would be given over to fast growing monoculture tree plantations. The burning of biomass may even be increasing carbon dioxide emissions. Drax, the UK’s largest biomass power station now produces four times as much carbon dioxide as the UK’s largest coal-fired power station.
Five minutes to midnight messages may be motivated to try to galvanise action, to stress the urgency of the situation and that we still (just) have time. But time for what? Climate policy only ever offers gradual change, certainly nothing that would threaten economic growth, or the redistribution of wealth and resources.
Despite the mounting evidence that globalised, industrialised capitalism is propelling humanity towards disaster, five minutes to midnight does not allow time and space to seriously consider alternatives. Instead, the solutions on offer are techno fixes that prop up the status quo and insists that fossil fuel companies such as Shell must be part of the solution.
That is not to say there are no good faith arguments for 1.5°C. But being well motivated does not alter reality. And the reality is that warming will soon pass 1.5°C, and that the Paris agreement has failed. In the light of that, repeatedly asking people to not give up hope, that we can avoid a now unavoidable outcome risks becoming counterproductive. Because if you insist on the impossible (burning fossil fuels and avoiding dangerous climate change), then you must invoke miracles. And there is an entire fossil fuel industry quite desperate to sell such miracles in the form of CCS.
Four suggestions
Humanity has enough problems right now, what we need are solutions. This is the response we sometimes get when we argue that there are fundamental problems with the net zero concept and the Paris agreement. It can be summed up with the simple question: so what’s your suggestion? Below we offer four.
1. Leave fossil fuels in the ground
The unavoidable reality is that we need to rapidly stop burning fossil fuels. The only way we can be sure of that is by leaving them in the ground. We have to stop exploring for new fossil fuel reserves and the exploitation of existing ones. That could be done by stopping fossil fuel financing.
At the same time we must transform the food system, especially the livestock sector, given that it is responsible for nearly two thirds of agricultural emissions. Start there and then work out how best the goods and services of economies can be distributed. Let’s have arguments about that based on reality not wishful thinking.
2. Ditch net zero crystal ball gazing targets
The entire framing of mid and end-century net zero targets should be binned. We are already in the danger zone. The situation demands immediate action, not promises of balancing carbon budgets decades into the future. The SBTi should focus on near-term emissions reductions. By 2030, global emissions need to be half of what they are today for any chance of limiting warming to no more than 2°C.
It is the responsibility of those who hold most power – politicians and business leaders – to act now. To that end we must demand twin targets – all net zero plans should include a separate target for actual reductions in greenhouse gas emissions. We must stop hiding inaction behind promises of future removals. It’s our children and future generations that will need to pay back the overshoot debt.
3. Base policy on credible science and engineering
All climate policies must be based on what can be done in the real world now, or in the very near future. If it is established that a credible amount of carbon can be removed by a proposed approach – which includes capture and its safe permanent storage – then and only then can this be included in net zero plans. The same applies to solar geoengineering.
Speculative technologies must be removed from all policies, pledges and scenarios until we are sure of how they will work, how they will be monitored, reported and validated, and what they will do to not just the climate but the Earth system as a whole. This would probably require a very large increase in research. As academics we like doing research. But academics need to be wary that concluding “needs more research” is not interpreted as “with a bit more funding this could work”.
4. Get real
Finally, around the world there are thousands of groups, projects, initiatives, and collectives that are working towards climate justice. But while there is a Climate Majority Project, and a Climate Reality Project, there is no Climate Honesty Project (although People Get Real does come close). In 2018 Extinction Rebellion was formed and demanded that governments tell the truth about the climate crisis and act accordingly. We can now see that when politicians were making their net zero promises they were also crossing their fingers behind their backs.
We need to acknowledge that net zero and now overshoot are becoming used to argue that nothing fundamental needs to change in our energy intensive societies. We must be honest about our current situation, and where we are heading. Difficult truths need to be told. This includes highlighting the vast inequalities of wealth, carbon emissions, and vulnerability to climate change.
The time for action is now
We rightly blame politicians for failing to act. But in some respects we get the politicians we deserve. Most people, even those that care about climate change, continue to demand cheap energy and food, and a constant supply of consumer products. Reducing demand by just making things more expensive risks plunging people into food and energy poverty and so policies to reduce emissions from consumption need to go beyond market-based approaches. The cost of living crisis is not separate from the climate and ecological crisis. They demand that we radically rethink how our economies and societies function, and whose interests they serve.
To return to the boiling frog predicament at the start, it’s high time for us to jump out of the pot. You have to wonder why we did not start decades ago. It’s here that the analogy offers valuable insights into net zero and the Paris agreement. Because the boiling frog story as typically told misses out a crucial fact. Regular frogs are not stupid. While they will happily sit in slowly warming water, they will attempt to escape once it becomes uncomfortable. The parable as told today is based on experiments at the end of the 19th century that involved frogs that had been “pithed” – a metal rod had been inserted into their skulls that destroyed their higher brain functioning. These radically lobotomised frogs would indeed float inert in water that was cooking them alive.
Promises of net zero and recovery from overshoot are keeping us from struggling to safety. They assure us nothing too drastic needs to happen just yet. Be patient, relax. Meanwhile the planet burns and we see any sort of sustainable future go up in smoke.
Owning up to the failures of climate change policy doesn’t mean giving up. It means accepting the consequences of getting things wrong, and not making the same mistakes. We must plan routes to safe and just futures from where we are, rather where we would wish to be. The time has come to leap.
For you: more from our Insights series:
- We found over 300 million young people had experienced online sexual abuse and exploitation over the course of our meta-study
- The discovery of insulin: a story of monstrous egos and toxic rivalries
- A century ago, the women of Wales made an audacious appeal for world peace – this is their story
- How to solve our mental health crisis
To hear about new Insights articles, join the hundreds of thousands of people who value The Conversation’s evidence-based news. Subscribe to our newsletter.![]()
James Dyke, Associate Professor in Earth System Science, University of Exeter; Robert Watson, Emeritus Professor in Environmental Sciences, University of East Anglia, and Wolfgang Knorr, Senior Research Scientist, Physical Geography and Ecosystem Science, Lund University
This article is republished from The Conversation under a Creative Commons license. Read the original article.