by DGR News Service | Jul 8, 2022 | ANALYSIS, The Problem: Civilization
Editor’s note: Globalization is the process of increasing global integration between countries and regions. This increased connectivity is largely driven by trade. Enabled by the explosion of fossil fuel use over the past 150 years, global trade networks have opened up previously inaccessible natural communities (“ecosystems”) to market pressure, which has vastly accelerated the ecological crisis.
Globalization is an atrocity for the living planet. Today, forests in the southeastern United States are ground into pellets and sent to Europe to be burned in “green” power plants. Mineral ores are ripped from the ground in South America and shipped to processing plants and factories in Southeast Asia. Nigerian oil fills Delhi streets with smog. And factories around the world produce endless streams of consumer goods to fill homes that have tripled in size over the last 50 years.
As the Zapatista National Liberation Army (EZLN) has stated, ““The neoliberal globalization of capitalism is based on exploitation, plunder, contempt and repression for those who resist it — in other words, the same as before, only now globalized.” And meanwhile, every indicator of ecological health—greenhouse gas emissions, oceanic dead zones, species extinctions, plastics in the ocean, overpopulation, urban sprawl, etc.—is heading in the wrong direction.
The following article focuses mainly on the human impacts of globalization, which are brutal and feed inequality. As the then-Prime Minister of Jamaica said in 1977, “We are condemned to poverty by the nature of the exchange. There is nowhere else to go except down.”
By Joseph Grosso / CounterPunch
It is perhaps a wonder that it was not until experiencing the fallout from a global pandemic, that most Americans were forced to read or hear the words ‘supply chain’ or ‘logistics.’ Surprising both because it is on these things that the basic essentials of modern life are dependent and because of the revolutionary changes in these arenas over the past generation. Yet with COVID still haunting the global economy, as of this writing China is only just emerging from the largest COVID lockdown since Wuhan, and with inflation at the highest it’s been in decades, uncertainty about supply chains lingers.
Over the past twelve months this uncertainty has assumed many forms. There have been reports of shutdowns of factories in Asia, with workers reluctant to return to their jobs, ships backed up by the dozen at American ports, a shortage of truck drivers, and exploding wealth for the likes of Jeff Bezos. Obviously, the immediate trigger to the crisis would appear to be a mix of COVID and as a result Americans greatly increasing their online shopping. According to U.S. Census Bureau data, e-commerce sales jumped nearly 32 percent in 2020, and 50.5 percent since 2019. Overall, online sales now account for 19 percent of retail. Given the $400 billion in government stimulus and much of the outdoor service economy locked down (i.e. restaurants, movies, sports events, etc.), Americans spent nearly $1 trillion more in goods in 2021 compared to pre-pandemic times. Hard to see any supply chain not getting strained. Still, in May 2022 only 11 percent of shipments from Asia arrived in North America on time, down from 59 percent in May 2020.
By the end of 2021 the cost of shipping from Asia to the west coast of the U.S. had risen 330 percent in one year. According to the Freightos Baltic Index, as of June 22ndthe average global price to ship a 40-foot container was $7261, down from a peak of over $11,000 in September 2021, but still five times higher than before the pandemic. The United Nations Conference on Trade and Development (UNCTAD) estimated that higher shipping rates during the lockdown raised the inflation rate by 1.5 percent.
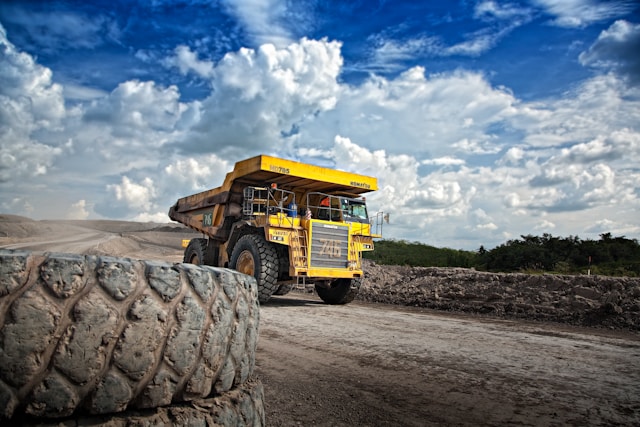
Step back further though and a fuller picture emerges, one featuring globalization, exploitation, and deindustrialization. It is no secret that the U.S. has lost millions of manufacturing jobs over the past generation- about 7.5 million since 1980. While automation has been a big factor in the decline, so has outsourcing and subcontracting. From 1970 to 2010 the number of manufacturing jobs in East Asia more than tripled from 31 million to 97 million. In the decade from 1997 to 2007 value of East Asian exports increased from $269 billion to nearly $1.5 trillion. Of course, the emergence of China as the world’s factory played a vital role. Foreign direct investment into China increased from $57 million in 1980 to $114.7 billion in 2010. Imports from China reached $506 billion in 2021 (with $151 billion in exports headed the other way, a trade deficit of $355 billion). Imports from Vietnam have also exploded over the past two decades. In 2020, Vietnam was the 6th largest supplier of U.S. imports, up 21.2 percent from just 2019, and 436 percent from 2010. In a way, Vietnam has been the winner of the U.S. trade war with China. The U.S. trade deficit with Vietnam exploded nearly threefold to $90 billion since 2018 (as for the effectiveness of the U.S. tariffs: a good amount of the exports from Vietnam originate in Chinese-owned factories). Indonesia imports are up 23 percent since 2010.
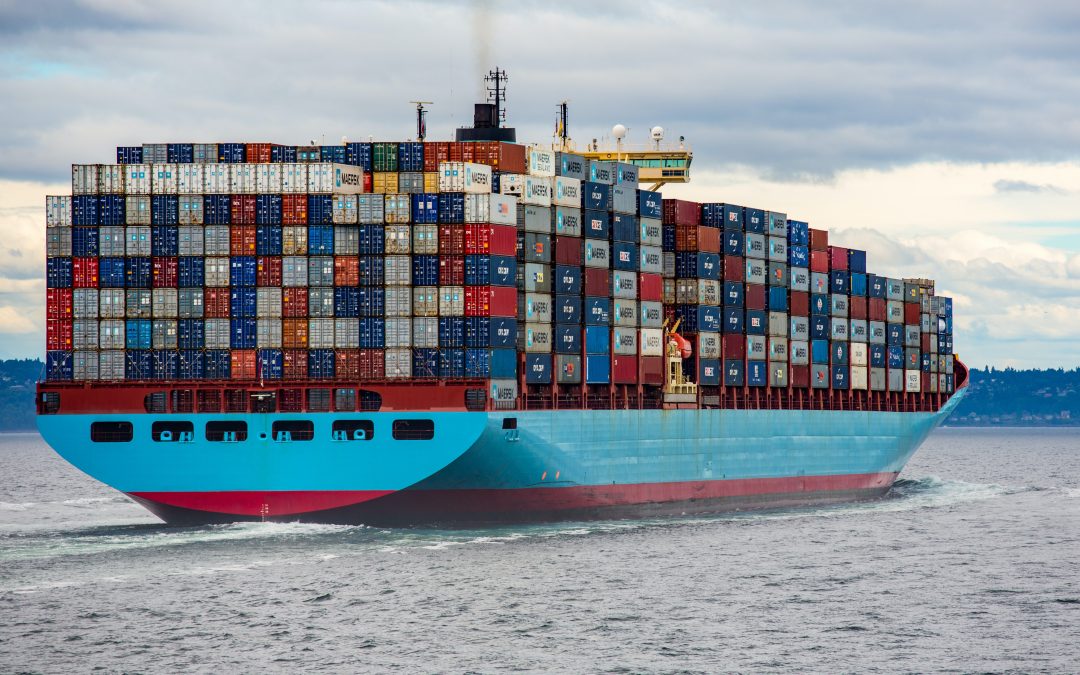
Nothing exemplifies the supply chain crisis quite like the sight of cargo ships backed up by the dozens outside the Ports of Los Angeles and Long Beach. Containerships transport 90 percent of global trade and these two ports handle about 40 percent of U.S. imports. A ship from China takes 15-20 day journey to an American port. The process of turning a ship around from China to the U.S. typically takes around 60 days. The process is supposed to be timed for maximum efficiency, one ship in, one out. COVID fouled up the system. At peak chaos there were over 100 ships waiting to dock. If all the waiting containers had been laid out the line would actually have stretched from Los Angeles to Chicago. The turnover time increased to 100 days. Biden eventually ordered the ports to work 24/7 and some ships were diverted to other ports. Ships waiting outside the LA ports fell by half by the beginning of 2022, though this spring a dozen plus ships were often backed up at ports around the U.S. As of May nearly 20 percent of container vessels globally were still waiting outside congested ports, including hundreds in China.
In a perfectly surreal example of built-in absurdity, the price hike made a trip from Asia to the U.S. 20 times more expensive than a trip going the other way. Therefore through the pandemic there were reports of ships returning to Asia with many of their containers empty. The shippers have been rejecting U.S. agricultural exports. It is more profitable to simply return to Asia and refill there rather than wait for food to be loaded and carried back. This past holiday season, some of the largest U.S. retailers were chartering their own, smaller ships to get around the backlog, docking at smaller ports around the country. Of course, this option was beyond the great majority of U.S. businesses.
If such a picture brings to mind any notions of incompetence or inefficiency, from the perspective of the shipping industry these can be quickly cast aside. In 2021 global shipping earnings equaled the entire industry’s earnings from the previous decade. Last November, the Wall Street Journal ran an article titled ‘For Investors in Shipping, Payoff at last.’ The opening lines read: ‘Global supply-chain bottlenecks are creating headaches for retailers, delays for consumers- and big gains for financial firms that invested in container ships before the pandemic upended the logistics business.’
The emergence of COVID has not been the only recent cause of disruption for the shipping supply chain. On March 23, 2021, the 20,124 TEU containership Ever Given ran aground in the Suez Cancel (TEU stands for Twenty-Foot Equivalent Unit, meaning the number of standardized 20-feet containers a ship can carry). The shortest shipping route between Europe and Asia, up to 15 percent of global trade passes through the Suez Canal, including a million barrels of oil a day and roughly 8 percent of the supply of liquefied natural gas. On a given day that means about 50 ships. With Ever Given wedged in the canal for a week, hundreds of ships were backed up in a 60-mile queue waiting to get through. All in all, an estimated $9.6 billion a day worth of trade was held up.
On March 15 2022, another ship owned by Evergreen Marine Corp, this one named Ever Forward, went aground in Chesapeake Bay. While this blockage did not stop traffic it took a month to free the ship. The ship CSCL Jupiter did hinder ship traffic when it ran aground for a day outside the port of Antwerp in 2017.
Given that navigational technology has improved in recent years ship groundings should be becoming less common. Yet there is the sheer size of the current ships. A few months after the Ever Given jam, the largest containership ever built, Ever Ace (another by the Evergreen Marine Corp), made its way through the Suez Canal in August 2021. Measuring just over 1300 feet (about the size of the Empire State Building) with a capacity of nearly 24,000 TEU (23,992 to be exact), Ever Ace took the title from the HMM Algeciras (23,964 TEU) which took its maiden voyage hardly a year earlier. Both ships are just part of expanding fleets of mega-ships of that size soon to be sailing.
For perspective, the largest ships today are 15 times what they were in the late 1960s around the time when containerization was standardized. The world’s first commercially successful container trip, Malcolm McLean’s coverted tanker, the Ideal-X, took 58 containers from New Jersey to Texas in 1956. When the ship Encounter Bay, one of the early fully cellular containerships, went into service in 1969 its capacity was 1578 TEUs. Even by the year 2000 ship capacity topped out at around 8000 TEUs. Then when the shipping company Maersk introduced its E-Series of ships in 2006, capacity reached around 15,000 TEUs, basically doubling the capacity of the previous largest ships. Since then over 130 ships have launched with a carrying capacity between 18,000 and 24,000 TEUs. In the past decade alone or so capacity has gone up 80 percent.
Here is where the deregulation comes in. As Matt Stroller described in a Substack piece, for most of the 20thcentury U.S. shipping law was based on the Shipping Act of 1916. The act granted shipping companies an exemption from anti-trust laws. They were allowed to form alliances with each other (something that continues today) where they would jointly set routes and prices. However there was a condition that all prices had to be public, service had to be offered on equal terms, and companies were not permitted to undermine competitors by offering volume discounts or under-the-table rebates. In addition to the Act, there were subsidies for shipbuilding and the Merchant Marine Act of 1920 (known as the Jones Act) which requires all ships carrying goods between two U.S. ports to be American-built, -owned, -crewed, and-flagged. The idea was to protect smaller companies and businesses against predatory moves of larger companies by giving bargaining power (hence the public prices). National security concerns wanted to keep American shipping strong. Stable prices take the edge off a boom-and-bust industry.
The system was tossed aside by the Ocean Shipping Reform Act of 1998. In a sense we were left the worst of all worlds: the anti-trust exemption was kept and the transparency was scrapped. Predictably, concentration in the industry exploded. Up to 60 of the 1000 largest ocean carriers have vanished since the early 2000s. Banks were only too eager to provide funding for the megaship arms-race. Shipping companies are good lending targets as valuable ships can simply be repossessed in the event of a default. Plus shipping often receives government subsidies.
In the midst of all this came the economic crash of 2008. The downturn meant there wasn’t enough freight to fill the growing ship capacity. With shipping prices at rock bottom the remaining large carriers formed alliances. The Top 10 shipping companies had 40 percent of the market in 1998. Today it is over 80 percent. All ten companies are part of one of the three company alliances that dominate the industry- 2M, Oceans Alliance, and The Alliance. The megaships also keep up a nice barrier to entry. New companies have a hard time breaking in with such upfront costs as a megaship. Infrastruture (railroads, ships, social media networks) tend to require a huge amount of investment to build, but not much to operate. This makes it inefficient for many companies to build competing networks. As a result it is often owned by the state of too-big-to-fail monopolies.
The larger the ship the more the shipping company is supposed to be able to squeeze out savings on construction, fuel, and staff. The larger the ships size to go with consolidation and alliance also give companies leverage over other parts of the system. This led to an arms race among the ports. Ports in Baltimore, Miami, and Norfolk began dredging projects to deepen their harbors. The Port Authority of New York and New Jersey spearheaded a project to raise the Bayonne Bridge 64 feet to accommodate larger ships. The project cost $1.7 billion. Such works are quite convenient for the carriers as they get almost all the savings while the ports, and the taxpayers that often contribute funding, foot the bill. As larger ships are unable to service as many ports as smaller ones, they lead increased concentration of terminal operators and therefore port traffic, one reason the Ports of Los Angeles and Long Beach handle so much traffic and are therefore prone to backups.
A few weeks ago, in the face of raising inflation, President Biden ranted about ‘foreigned owned’ shipping companies who raised their prices by ‘as much as 100 pecent.’ He chimed ‘Every now and then something you learned makes you viscerally angry.’ On June 16th, he signed the Ocean Shipping Reform Act of 2022. Legislation that breezes through Congress nowadays promises not to be too earthshattering. The act empowers the Federal Maritime Commission to limit ocean carriers refusing American and limit port fees. It is questionable how thoroughly it can be enforced.
Another facet to the shipping world is flags of convenience. For a fee ship owners can simply register their ships with a willing country. Countries without a nationality or residency requirement for ship registration are described as having open registry. This form of paper globalization works the same as other forms. The obvious goal is to take advantage of places with low wages and less regulation. Thus in 1960 the U.S. flag merchant fleet had almost 3000 ships. By 2019 the number was 182. Almost three-quarters of the worl’d fleet is now flagged under a country different from the ship owners. For a long time the places with the largest registries have been Panama, Liberia, and the Marshall Islands. In her book Ninety Percent of Everything, Rose George explains:
‘There are few industries as definitely opaque as shipping. Even offshore bankers have not developed a system as intricately elusive as the flag of convenience, under which ships can fly the flag of a state that has nothing to do with its owner, crew, or route.’
While the International Maritime Organization, a UN agency, has passed plenty of regulations since its inception, and the International Labor Organization (ILO) has adopted stadards for seafarers- the Maritime Labor Convention was ratified in 2006 by 80 countries and came into effect in 2013, the ocean has a tendancy to dissolve such paper. As with many things, the COVID pandemic brought the underbelly to light.
In September 2020, as 300,000 workers were stranded on ships, a Bloomberg report found dozens of labor violations. Of the 40 seafarers interviewed for the story, half didn’t have current contracts and others hadn’t been paid for months, meeting the ILO’s definition of forced labor. Shipping lines and staffing agencies (as in other industries such as meatpacking, shippers often outsource hiring to agencies), determine when and how workers return home, even holding their passports. In an industry rife with middlemen, including networks of owners, operators, and employmeny agencies, it is difficult to hold parties accountable.
By no means is shipping the only leg of the supply chain that is hellish for workers. In the U.S. when goods are unloaded from shipping containers they are moved onto truck beds. Trucks move around 70 percent of domestic goods, over ten billion tons of freight a year. Truck drivers’ wages have plummeted over the past four decades. If the adjusted average wage of a truck driver in 1980 was $110,000, by 2019 the trucker earned $45,000 a year- a decline of 60 percent. From there goods are often driven to warehouses. The turnover rate at Amazon warehouses can reach 150 percent a year. Buy commodities certified ‘Fair Trade’ as you will, just don’t assume such a concept applies to the workers that bring them to you.
by Deep Green Resistance News Service | Feb 27, 2018 | ANALYSIS, Toxification
by Alex Jensen / Local Futures
That pollution is bad for our health will come as a surprise to no one. That pollution kills at least 9 million people every year might. This is 16 percent of all deaths worldwide – 3 times more than AIDS, tuberculosis and malaria combined, and 15 times more than all wars and other forms of violence. Air pollution alone is responsible for 6.5 million of these 9 million deaths. Nearly 92 percent of pollution-related deaths occur in low- and middle-income countries. All this is according to the Lancet Commission on Pollution and Health, a recent report by dozens of public health and medical experts from around the world. This important report is sounding the alarm about a too-often neglected and ignored “silent emergency”—or as author Rob Nixon calls it, “slow violence.”
In one media article about the report, the Lancet’s editor-in-chief and executive editor points to the structural economic forces of “industrialisation, urbanisation, and globalisation” as “drivers of pollution.” Unfortunately, however, the report itself doesn’t elaborate upon this crucial observation about root causes – in fact, when it moves from documentation of the pollution-health crisis to social-economic analysis, some of the report’s conclusions go seriously awry, espousing debunked “ecological modernization theory” and reinforcing a tired Eurocentric framing that paints the industrialized West in familiar “enlightened” colors, while the “developing” countries are portrayed as “backward.”
For example, one of the Commission’s co-chairs and lead authors Dr. Philip Landrigan (for whom I have the greatest respect for his pioneering work in environmental health), points out that since the US Clean Air Act was introduced in 1970, levels of six major pollutants in the US have fallen by 70 percent even as GDP has risen by 250 percent. According to fellow author Richard Fuller, this sort of trend proves that countries can have “consistent economic growth with low pollution.”
Coupled with the fact that about 92 percent of pollution-related deaths occur in low- and middle-income countries, this would indeed appear to validate one of the core doctrines of ecological modernization theory—”decoupling”—which posits that while pollution necessarily increases during the early “stages” of economic development, it ultimately plateaus once a certain level of wealth is achieved, whereupon it falls even as growth continues ever upward.
It is understandable why the Commission might want to package its message in this way: it makes an “economic” case for addressing pollution that is palatable to policymakers increasingly ensconced within an economistic worldview, one that is increasingly blind to non-economic values (including, apparently, the value of life itself – one would have hoped that 9 million deaths would be reason enough to take action against pollution). The economic costs of pollution, along with the apparent happy coexistence of economic growth and pollution reduction, are marshaled to challenge “the argument that pollution control kills jobs and stifles the economy.” This favorite bugbear of industry and big business is certainly spurious—forget about pollution control “killing jobs;” the absence of such control is killing millions of people every year!
But, as I showed in my previous blog post (Globalization Blowback), much of the rich countries’ pollution has been outsourced and offshored during the corporate globalization era. It is disingenuous at best to cite instances of local pollution reduction alongside increased economic growth in the rich world as evidence of decoupling, when those reductions were made possible only because of much larger pollution increases elsewhere. A global perspective—where true costs cannot be fobbed off on the poor and colonized—is necessary for gaining a meaningful and accurate picture of the relationship between wealth, growth, development and environmental integrity and sustainability. Panning out to this broader global perspective shows that, in fact, GDP growth and pollution continue to be closely coupled. And because a large percentage of the pollution in poorer countries is a consequence of corporate globalization, so is a large percentage of pollution-caused deaths.
Choking—and dying—on globalization
China’s export-oriented industrial spasm, powered largely by burning coal, has bequeathed it notoriously lethal air pollution, so much so that, according to one study, it contributes to the deaths of 1.6 million people per year (4,400 per day), or 17% of all deaths in the country. Another study puts the total at two-thirds of all deaths, and concluded that the severe air pollution has shortened life expectancy in China by more than 2 years on average, and by as much as 5.5 years in the north of the country.
Interestingly, some studies have actually calculated the number of globally dispersed premature deaths from transported air pollution and international trade. One such study found that deadly PM2.5 pollution (particulate matter of 2.5 micrometers or smaller) produced in China in 2007 was linked to more than 64,800 premature deaths in regions other than China, including more than 3,100 premature deaths in western Europe and the USA. At the same time—despite manufacturing- and pollution-offshoring—about 19,000 premature deaths occur in the US from domestically emitted pollution for the production of exports, 3,000 of which are linked to items exported to China.
But this is far less than what the Chinese are suffering because of consumption in the West. According to the study, “consumption in western Europe and the USA is linked to more than 108,600 premature deaths in China.” (Worldwide, pollution emitted for the production of goods and services consumed in the US alone caused 102,000 premature deaths; European consumption caused even more: 173,000 premature deaths). Note that the above fails to take into account the costs of various other air pollution-related chronic illnesses. And of course, air pollution isn’t the only harmful human cost of China’s coal-driven industrial growth and export-orientation. According to Chinese government statistics, some 6,027 Chinese coal miners died in the course of work in 2004, though analysts point out that official estimates are usually highly conservative, and “the real number is probably higher.” Since 2004, coal extraction has grown significantly in China.
Shipping
What about the transport of incomprehensible quantities of materials back and forth across the planet? Coal to China, commodities from China, waste back to China (the undisputed locus of global waste trade)—nearly all of it is done via oceanic shipping, which carries heavy ecological costs. The statistics on the scale and impact of the global shipping industry are arresting: a 2014 study found that ship traffic on the world’s oceans has increased 300 percent over the past 20 years, with most of this increase occurring in the last 10 years. According to one analysis, emissions from international shipping for 2012 were estimated to be 796 million tons of CO2 per year (or 90,868 tons per hour), more than the yearly emissions of the UK, Canada or Brazil. (An earlier study put the amount of annual emissions from the world’s merchant fleet at 1.12 billion tons of CO2.) Whatever the actual figure, shipping accounts for at least 3 to nearly 4.5 percent of global CO2 emissions.
Much worse, shipping contributes 18-30 percent of the world’s total NOx and 9 percent of its sulphur oxide (SOx) pollution. A single giant container ship can emit the same amount as 50 million cars: “just 15 of the world’s biggest ships may now emit as much pollution as all the world’s 760m cars.” By 2015, greenhouse gas emissions from shipping were 70 percent higher than in 1990, and, left unchecked, were projected to grow by up to 250 percent by 2050; this would make shipping responsible for 17 percent of global emissions. According to the University College London’s Energy Institute – whose astonishing ShipMap may be one of the best visualizations of globalization available—“China is the center of the shipping world; Shanghai alone moved 33 million units in 2012.”
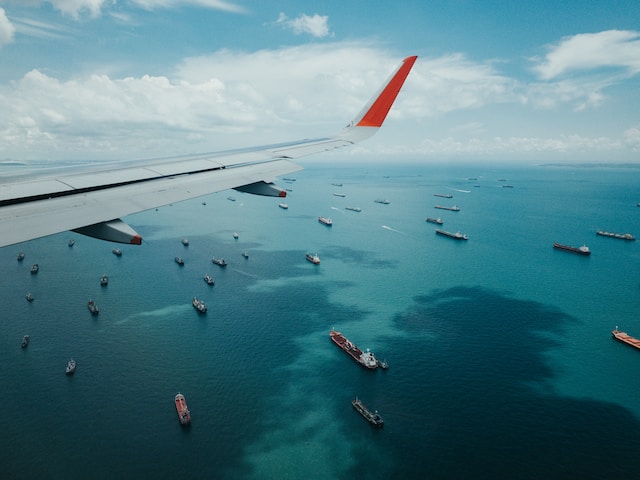
And this is only maritime shipping. Air freight is even more pollution-intensive: though much less merchandise and material is moved by air, some estimates are that the relatively minor 1% of the world’s food traded by air may contribute upwards of 11 percent of CO2 emissions.
In sum, the toll of the global shipping industry makes the “death footprint” of globalization’s air pollution even larger. A 2007 study conservatively estimated that just the PM (particulate matter) emissions of global shipping—estimated at 1.6 million metric tons—kill 60,000 people per year, which the authors expected to increase 40 percent by 2012.
Conclusions
To point out the harms of global pollution outsourcing is emphatically not to argue that US corporations, for example, should simply return their outsourced production and pollution to the territorial US. This was the erstwhile “Trumpian” right-populist recipe. Under this ideology, the way to facilitate “insourcing” is not to insist on higher labor and environmental standards abroad, but to systematically dismantle the framework of laws in the US (however weak many of them already are thanks to corporate-captured government agencies)—that is, to bring the race to the bottom home. Whether generous tax cuts and other hand-outs will entice the outsourcers back remains to be seen: it’s becoming evident that the Trump/Koch brothers enterprise is about both eviscerating domestic environmental and labor laws, and accelerating global transnational corporate pillage—the worst of all worlds.
An anti-corporate, degrowth, eco-localization stance is the unequivocal opposite. Firstly, it rejects the broader ends and means of the entire consumerist, throw-away project. Rather than merely bringing the disposable extractive economy back home, localization is about reconnecting cause and effect and overthrowing irresponsible and unethical environmental load displacement on the global poor. Localization is about re-orienting the entire economy towards sufficiency and simplicity of consumption, towards needs-based, ecologically-sustainable and regenerative production, and towards fair, dignified and democratic work and production. By definition, localization connotes less dependence on external resources and globalized production chains that are controlled by global corporations and are congenitally undemocratic. Putting power into workers’ hands is to not have globally—outsourcing, hierarchically—owned and managed corporations, tout court.
Of course Dr. Landrigan is right that reducing pollution doesn’t “stifle the economy”—quite the contrary, if “the economy” is understood in a much more holistic sense than mere GDP. But, as has been pointed out previously on this blog (here and here), we also shouldn’t equate a healthy economy with a growing economy. The converse is more often the case. To reduce global pollution deaths, we not only need robust pollution control regulations, we must reduce corporate power, globalization, and the scale of the economy as well.
Alex Jensen is a Researcher and Project Coordinator at Local Futures. He has worked in the US and India, where he co-ordinated Local Futures’ Ladakh Project from 2004-2015. He has also been an associate of the Sambhaavnaa Institute of Public Policy and Politics in Himachal Pradesh, India. He has worked with cultural affirmation and agro biodiversity projects in campesino communities in a number of countries, and is active in environmental health/anti-toxics work.
Photo by shawnanggg on Unsplash
by Deep Green Resistance News Service | Aug 19, 2017 | Toxification
Featured image: Public Health Watch
by Alex Jensen / Local Futures
A recent study of air pollution in the western United States made a startling finding: despite a 50 percent drop over the past 25 years in US emissions of smog-producing chemicals like nitrogen oxides (NOx), smog actually increased during that period in the rural US West – even in such ‘pristine’ environments as Yellowstone National Park. Most of this increase was traced to “the influx of pollution from Asian countries, including China, North and South Korea, Japan, India, and other South Asian countries.”[1] That’s because over the same period that NOx emissions declined in the US, they tripled in Asia as a whole.[2] In media reports of the study, China and India are described as the “worst offenders” of this fugitive “Asian pollution”.[3]
Left only with these findings, a reasonable conclusion would be that the US has become more environmentally enlightened in recent decades, while Asia – particularly ‘developing’ Asia – is a veritable eco-reprobate, sacrificing not only its own but global airsheds to choking pollution. The new, anti-environmental EPA director, Scott Pruitt, recently expressed this view in explaining why the US should exit the Paris Climate Accord: “[China and India] are polluting far more than we are.”[4]
What’s missing?
A similar study of global air pollution drift in 2014, focusing on China and the US, made comparable findings, but included an important factor missing from the more recent study: production for export. Among other things, the scholars of the older study asked how much of the Chinese air pollution drifting to the Western US was occasioned specifically in the production of exports for world markets (including the top destination for Chinese manufactures, the US.)
The answer? In 2006, up to 24% of sulfate concentrations over the western United States were generated in the Chinese production of goods for export to the US.[5] Applying these findings to the more recent study, it’s likely that a significant percentage of the Asian nitrogen oxides now choking the US West were also emitted in the production of goods destined for the US.
In other words, it’s meaningless to speak of “Asian pollution” in this context. Though the pollution was emitted in Asia, it properly belongs to the country/ies on whose behalf and at whose behest it was produced. Even more accurately, the pollution finally belongs to the transnational corporations (TNCs) who are the real drivers and beneficiaries not only of offshoring, but also of insatiable consumerism through marketing and obsolescence.
Economic globalization has enabled the manic scouring of the world by TNCs for the most ‘liberal’ (read: unregulated) environments in which to locate production facilities – the places where expenses can be minimized and profits maximized. Since the biggest drags on corporate profiteering come from taxes, environmental regulations, and decent labor protections and wages, the global relocations of TNCs have largely been towards countries where those costs are lowest, or absent altogether.
By increasing their economic power, globalization has also given TNCs the ability to capture governments, which then collude in further reshaping of the world through ‘free’ trade treaties, supra-national institutions like the IMF, WTO and World Bank, and subsidies and hand-outs to attract and retain big businesses.
This entire system of globalization, production and pollution off-shoring is driven by the profit-maximization logic governing transnational corporations, greased along by an ever-growing number of bilateral and global free trade treaties. As economist Martin Hart-Landsberg writes:
“Beginning in the late 1980s large multinational corporations, including those headquartered in the US, began a concerted effort to reverse declining profits by establishing cross border production networks (or global value chains). This process knitted together highly segmented economic processes across national borders in ways that allowed these corporations to lower their labor costs as well as reduce their tax and regulatory obligations. Their globalization strategy succeeded; corporate profits soared. It is also no longer helpful to think about international trade in simple nation-state terms.”[6]
China – having colluded with global capital in turning itself into the ‘factory of the world’[7] – is bearing the lion’s share of globalization’s brunt. But at least China is getting rich as a result, right? Certainly there is an emerging wealthy (and superwealthy) class within China that is profiting from globalization, but it represents a minuscule fraction of the overall population.[8] The mass of the workers who make up China’s labor and ‘bad-labor’[9]workforce are not benefiting from the country’s conversion into a TNC workshop: labor’s share of China’s GDP has been steadily falling since the late 1990s.[10] For a high-end electronic product like the iPhone, less than 2% (about US$10) of the sales price goes to Chinese workers involved in its production.[11]
So who is driving China’s export-oriented boom? Quoting Hart-Landsberg again, “it is not Chinese state enterprises, or even Chinese private enterprises, that are driving China’s exports to the US. Rather it is foreign multinationals, many of which are headquartered in the US, including Apple, Dell, and Walmart”.[12] By 2013, foreign-owned TNCs were responsible for 47% of all Chinese exports (and over 80% of high-tech exports) compared to a mere 11% by Chinese state-owned enterprises.[13] US-based TNCs dominate this control and ownership of exports made in China.
The division of profits from Chinese manufactures is also heavily skewed in favor of foreign corporations. For telecommunications equipment, China produced 38% of world exports in 2013, but their share of the profits generated by the sale of those products was just 6%, while US firms captured 59%. Similar imbalances obtain in the case of textiles, where US firms commandeered 46% of the profit share.[14]
From the production, sale and transport of globally-traded commodities, to the shipping of the resulting waste back to China,[15] and now to the profitable ‘adaptation’ to the ghastly air pollution,[16] TNCs are the main drivers and beneficiaries of this system. In other words, Chinese production and exports are dominated by US and other foreign corporations, and – like the pollution drifting across the globe – are not really ‘Chinese’ at all.[17]
This ‘Asian pollution’ may have an even deeper connection to the American west over which it is now drifting. The world’s largest surface mines are the Black Thunder mines, in the Powder River Basin straddling the Wyoming/Montana border. The mine’s owner and operator, Arch Coal, exports sizable amounts of this government-owned coal to places like China, where it is burned to power the factories that produce American consumer goods.[18]
==
It has been widely noted that American consumers have the largest ecological footprint in the world. While not completely absolving individuals – especially those on the upper rungs of the socio-economic ladder – for perpetuating this wasteful system, it can be argued that those large ecological footprints are not entirely their own. The combined effects of aggressive marketing, advertising, and planned product obsolescence[19] mean that the American consumer’s oversized footprint is largely a consequence and reflection of the global power of TNCs. In that sense, it is perhaps more accurate to speak of corporateecological footprints rather than the footprints of nations or individuals.
Globalization has meant the distancing of cause and effect, source and sink, so that the pollution and human exploitation caused in the production and transport of goods has remained invisible and opaque to consumers. As Wendell Berry says, “The global economy institutionalizes a global ignorance, in which producers and consumers cannot know or care about one another, and in which the histories of all products will be lost.”[20]
Until now, it seems, corporations’ pollution offshoring was easy enough for Northern policymakers to comfortably ignore – it was offshored, after all. Of course, global warming already showed that simply exporting polluting production to the global South was meaningless as far as the Earth’s atmosphere and climate were concerned. But local air quality was seen as something distinct, so that the smoggy horrors of industrializing China or India were, for places like North America, still at a ‘safe’ distance. No more. Now, in addition to the products that magically appear on Western store shelves absolutely shorn of history and provenance, much of the hitherto distant pollution emitted in their production has also arrived. It has come home to roost. Globalization’s blowback.
Republished with permission of Local Futures. For permission to repost, please contact info@localfutures.org
[1] Lin, M., Horowitz, L., Payton, R., Fiore, A., and Tonnesesn, G. (2017) ‘US surface ozone trends and extremes from 1980 to 2014: quantifying the roles of rising Asian emissions, domestic controls, wildfires, and climate’, Atmospheric Chemistry and Physics 17(4).
[2] Lin et al. 2017.
[3] e.g., Rice, D. (2017) ‘Air pollution in Asia is wafting into the USA, increasing smog in West’, USA Today, 2 March. https://www.usatoday.com/story/weather/2017/03/02/air-pollution-asia-wafting-into-usa-increasing-smog-west/98647354/#.
[4] Kessler 2017 ‘EPA Administrator Scott Pruitt’s claim that China and India have ‘no obligations’ until 2030 under the Paris Accord’, The Washington Post, 14 April. https://www.washingtonpost.com/news/fact-checker/wp/2017/04/14/epa-administrator-scott-pruitts-claim-that-china-and-india-have-no-obligations-until-2030-under-the-paris-accord/.
[5] Lin, J., Pan, D., Davis, S., Zhang, Q., He, K., Wang, C., Streets, D., Wuebbles, D., and Guan, D. (2014) ‘China’s international trade and air pollution in the United States’, PNAS111(5), 4 February. http://www.pnas.org/content/111/5/1736.abstract.
[6] Hart-Landsberg, M. (2017a) ‘Trump’s Economic Policies Are No Answer To Our Problems’, Reports from the Economic Front, 13 February. https://economicfront.wordpress.com/2017/02/13/trumps-economic-policies-are-no-answer-to-our-problems/.
[7] David Harvey, among others, tells the complicated tale of how this transformation occurred: Harvey, D. (2005) A Brief History of Neoliberalism, Oxford and New York: Oxford University Press. ‘Neoliberalism ‘with Chinese Characteristics’’ (ch. 5).
[8] By 2015 China was expected to have the world’s fourth-largest concentration (4.4 million) of wealthy people (Atsmon, Y. and Dixit, V. (2009) ‘Understanding China’s wealthy’, McKinsey Quarterly. http://www.mckinsey.com/business-functions/marketing-and-sales/our-insights/understanding-chinas-wealthy), and where 80 of the 113 Asian billionaires (and over half the world’s total) reside (71% of Asia’s new billionaires in 2015, up from 35% in 2009) ( (Butt, R. (2016) ‘China gets a new billionaire every 5 days’, Business Insider, 13 October. http://www.businessinsider.com/the-number-of-billionaires-growing-fastest-in-china-asia-2016-10).
[9] ‘Bad labor’ refers to vulnerable, health-damaging, gender unequal, child and forced labor. Simas and colleagues have looked at the relationship between globalization of production chains and ‘bad labor footprints’, and estimate that more than half of such footprints behind “wealthy lifestyles of affluent regions” occur in the production of exported goods in un-affluent regions/countries, with the majority of these being in Asia. Up to 30% of bad labor conditions in poor countries are related to the production of exports (Simas et al. 2014 ‘The “Bad Labor” Footprint: Quantifying the Social Impacts of Globalization’, Sustainability 6.).
[10] Hart-Landsberg 2017a, op cit.
[11] Ibid.
[12] ibid.
[13] ibid.
[14] Hart-Landsberg, M. (2017b) ‘US Corporations Continue Their Global Dominance’, Reports from the Economic Front, 21 April. https://economicfront.wordpress.com/2017/04/21/us-corporations-continue-their-global-dominance/.
[15] US exports of waste to China ballooned by 916 percent from 2004-2008, with most of that expansion occurring after 2004 (Allen, J. (2010) ‘America’s Biggest Trade Export to China? Trash’, US News & World Report, 3 March. https://www.usnews.com/opinion/blogs/jodie-allen/2010/03/03/americas-biggest-trade-export-to-china-trash) and over half of US plastic waste – and 40% of the world’s – goes to China (Guilford, G. (2013) ‘US states banned from exporting their trash to China are drowning in plastic’, Quartz, 21 August. https://qz.com/117151/us-states-banned-from-exporting-their-trash-to-china-are-drowning-in-plastic/). In 2012, the US exported nearly 90% of its annual 10 million tons of toxic electronic-waste to Asia, expected to increase 33% by this year (Lewis, T. (2013) ‘World’s E-Waste to Grow 33% by 2017, Says Global Report’, LiveScience, 15 December. http://www.livescience.com/41967-world-e-waste-to-grow-33-percent-2017.html).
[16] E.g. Rivera, G. (2013) ‘Pollution in China: The Business of Bad Air’, World Affairs Journal, May/June. http://www.worldaffairsjournal.org/article/pollution-china-business-bad-air; Ferris, R. (2014) ‘Pollution has boosted 3M sales in China’, CNBC, 18 December. http://www.cnbc.com/2014/12/18/china-makes-pollution-3m-makes-products-to-help-them-with-it.html; Luedi, J. (2016) ‘Meet the companies cashing in on China’s pollution crisis’, Global Risk Insights, 14 January. http://globalriskinsights.com/2016/01/meet-the-companies-cashing-in-on-chinas-pollution-crisis/.
[17] Hart-Landsberg, M. (2017b) ‘US Corporations Continue Their Global Dominance’, Reports from the Economic Front, 21 April. https://economicfront.wordpress.com/2017/04/21/us-corporations-continue-their-global-dominance/.
[18] Warrick, J. (2015) ‘U.S. exports its greenhouse-gas emissions — as coal. Profitable coal’, The Washington Post, 15 October. https://www.washingtonpost.com/world/us-exports-its-greenhouse-gas-emissions—as-coal-profitable-coal/2015/10/08/05711c92-65fc-11e5-bdb6-6861f4521205_story.html.
[19] See Gorelick, S. (2017) ‘Our Obsolescent Economy’, Local Futures blog, http://www.localfutures.org/our-obsolescent-economy/
[20] Berry, W. (2003) ‘The Whole Horse’, in Citizenship Papers, Shoemaker and Hoard.

by DGR News Service | Apr 27, 2025 | ANALYSIS, The Problem: Civilization
Editor’s note: “I think we’re in the midst of a collapse of civilization, and we’re definitely in the midst of the end of the American empire. And when empires start to fail, a lot of people get really crazy. In The Culture of Make Believe, I predicted the rise of the Tea Party. I recognized that in a system based on competition and where people identify with the system, when times get tough, they wouldn’t blame the system, but instead, they would indicate it’s the damn Mexicans’ fault or the damn black people’s fault or the damn women’s fault or some other group. The thing that I didn’t predict was that the Left would go insane in its own way. I anticipated the rise of an authoritarian Right, but not authoritarianism more generally, to which the Left is not immune. The collapse of empire results in increased insecurity and the demand for stability. The cliché about Mussolini is that he made the trains run on time, that he brought about stability.” – Derrick Jensen
It’s not just stupid people. People can be very smart as individuals, but collectively we are stupid. Postmodernism is a case in point. It starts with a great idea, that we are influenced by the stories we’re told and the stories we’re told are influenced by history. It begins with the recognition that history is told by the winners and that the history we were taught through the 1940s, 50s and 60s was that manifest destiny is good, civilization is good, expanding humanity is good. Exemplary is the 1962 film How the West Was Won. It’s extraordinary in how it regards the building of dams and expansion of agriculture as simply great. Postmodernism starts with the insight that such a story is influenced by who has won, which is great, but then it draws the conclusion that nothing is real and there are only stories.
“This is the cult-like behavior of the postmodern left: if you disagree with any of the Holy Commandments of postmodernism/queer theory/transgender ideology, you must be silenced on not only that but on every other subject. Welcome to the death of discourse, brought to you by the postmodern left.”
Explainer: what is postmodernism?
Daniel Palmer, Monash University
I once asked a group of my students if they knew what the term postmodernism meant: one replied that it’s when you put everything in quotation marks. It wasn’t such a bad answer, because concepts such as “reality”, “truth” and “humanity” are invariably put under scrutiny by thinkers and “texts” associated with postmodernism.
Postmodernism is often viewed as a culture of quotations.
Take Matt Groening’s The Simpsons (1989–). The very structure of the television show quotes the classic era of the family sitcom. While the misadventures of its cartoon characters ridicule all forms of institutionalised authority – patriarchal, political, religious and so on – it does so by endlessly quoting from other media texts.
This form of hyperconscious “intertextuality” generates a relentlessly ironic or postmodern worldview.
Relationship to modernism
The difficulty of defining postmodernism as a concept stems from its wide usage in a range of cultural and critical movements since the 1970s. Postmodernism describes not only a period but also a set of ideas, and can only be understood in relation to another equally complex term: modernism.
Modernism was a diverse art and cultural movement in the late 19th and early 20th centuries whose common thread was a break with tradition, epitomised by poet Ezra Pound’s 1934 injunction to “make it new!”.
The “post” in postmodern suggests “after”. Postmodernism is best understood as a questioning of the ideas and values associated with a form of modernism that believes in progress and innovation. Modernism insists on a clear divide between art and popular culture.
But like modernism, postmodernism does not designate any one style of art or culture. On the contrary, it is often associated with pluralism and an abandonment of conventional ideas of originality and authorship in favour of a pastiche of “dead” styles.
Postmodern architecture
The shift from modernism to postmodernism is seen most dramatically in the world of architecture, where the term first gained widespread acceptance in the 1970s.
One of the first to use the term, architectural critic Charles Jencks suggested the end of modernism can be traced to an event in St Louis on July 15, 1972 at 3:32pm. At that moment, the derelict Pruitt-Igoe public housing project was demolished.
Built in 1951 and initially celebrated, it became proof of the supposed failure of the whole modernist project.
Jencks argued that while modernist architects were interested in unified meanings, universal truths, technology and structure, postmodernists favoured double coding (irony), vernacular contexts and surfaces. The city of Las Vegas became the ultimate expression of postmodern architecture.
Famous theorists
Theorists associated with postmodernism often used the term to mark a new cultural epoch in the West. For philosopher Jean-François Lyotard, the postmodern condition was defined as “incredulity towards metanarratives”; that is, a loss of faith in science and other emancipatory projects within modernity, such as Marxism.
Marxist literary theorist Fredric Jameson famously argued postmodernism was “the cultural logic of late capitalism” (by which he meant post-industrial, post-Fordist, multi-national consumer capitalism).
In his 1982 essay Postmodernism and Consumer Society, Jameson set out the major tropes of postmodern culture.
These included, to paraphrase: the substitution of pastiche for the satirical impulse of parody; a predilection for nostalgia; and a fixation on the perpetual present.
In Jameson’s pessimistic analysis, the loss of historical temporality and depth associated with postmodernism was akin to the world of the schizophrenic.
Postmodern visual art
In the visual arts, postmodernism is associated with a group of New York artists – including Sherrie Levine, Richard Prince and Cindy Sherman – who were engaged in acts of image appropriation, and have since become known as The Pictures Generation after a 1977 show curated by Douglas Crimp.
By the 1980s postmodernism had become the dominant discourse, associated with “anything goes” pluralism, fragmentation, allusions, allegory and quotations. It represented an end to the avant-garde’s faith in originality and the progress of art.
But the origins of these strategies lay with Dada artist Marcel Duchamp, and the Pop artists of the 1960s in whose work culture had become a raw material. After all, Andy Warhol was the direct progenitor of the kitsch consumerist art of Jeff Koons in the 1980s.
Postmodern cultural identity
Postmodernism can also be a critical project, revealing the cultural constructions we designate as truth and opening up a variety of repressed other histories of modernity. Such as those of women, homosexuals and the colonised.
The modernist canon itself is revealed as patriarchal and racist, dominated by white heterosexual men. As a result, one of the most common themes addressed within postmodernism relates to cultural identity.
American conceptual artist Barbara Kruger’s statement that she is “concerned with who speaks and who is silent: with what is seen and what is not” encapsulates this broad critical project.
The discourse of postmodernism is associated with Australian artists such as Imants Tillers, Anne Zahalka and Tracey Moffatt.
Australia has been theorised by Paul Taylor and Paul Foss, editors of the influential journal Art & Text, as already postmodern, by virtue of its culture of “second-degree” – its uniquely unoriginal, antipodal appropriations of European culture.
If the language of postmodernism waned in the 1990s in favour of postcolonialism, the events of 9/11 in 2001 marked its exhaustion.
While the lessons of postmodernism continue to haunt, the term has become unfashionable, replaced by a combination of others such as globalisation, relational aesthetics and contemporaneity.
Daniel Palmer, Senior Lecturer, Art History & Theory Program, Monash University
This article is republished from The Conversation under a Creative Commons license. Read the original article.
Photo by Mike Von on Unsplash