by Deep Green Resistance News Service | Mar 6, 2013 | Climate Change


By Daniel Whittingstall / Deep Green Resistance Vancouver
The Situation and Our Options
Increased concentrations of atmospheric greenhouse gases (GHG), primarily carbon dioxide emitted from the burning of fossil fuels for cheap energy, have driven global average temperatures to rise. While this in itself is cause for concern, the real distressing predicament lies within the many positive feedbacks that are at or near their tipping points.
One major positive feedback is the arctic permafrost where large amounts of methane (a greenhouse gas) are stored underground. If the temperature continues to rise from the current 0.8C up to 1.5C above pre-industrial levels the permafrost will hit a tipping point and melt, releasing roughly 1,000 giga-tones of methane (which is 22 times more potent a greenhouse gas than C02 over a 100 yr. period, and 150 times more potent over a period of a couple years) into the atmosphere.
Since the global temperature is currently being raised due to Industrial Civilization’s increase of these GHG’s, and there is a time-lag between temperature rise and GHG levels (temperature catching up to where these gases have set the bar, roughly a 30 yr. time-lag), then all we need to do to find out how close we are to this tipping point is to look at current and historic levels of GHG’s and the correlating temperatures, right? Come walk with me for a moment.
Current C02 levels are at 395 ppm (C02 being the main factor in the last 180 yrs. of forcing temperature rise, most of which has increased in the past 30 yrs.). The last time C02 levels were this high was roughly 15 million years ago (mya), with temperatures roughly 3-6C above current levels (or 4-7C above pre-industrial times). It would be good to note here that projected emissions and C02 levels by 2030, if “business as usual” continues, will be around 516-774 ppm; levels closer to those of the Eocene 54-50 mya when temperatures were roughly 5-7C higher than today.
Since there is a time-lag between temperature rise and levels of C02 we can be certain that the temperature will rise 3-6C over the next 30 yrs. solely based on current levels of C02 alone. This of course would be the case without adding in any positive feedbacks like the melting of permafrost, arctic sea ice, ice caps, glaciers, ocean die offs due to acidification and rapid forest die offs due to drought/deforestation etc.
The thing is, the world has changed quite a bit in the last 15 myr. A lot more carbon, and other substances with the potential to turn into GHG’s, have been stored in the earths surface due to the resumption of glacial cycles (since 13 mya the earth has plummeted into glacial cycles-5 mya and rapid glacial cycles-2.5 mya), increasing the potential/possibility with which to warm the globe if they were ever to be fully released.
You see, the other tricky part about this time-lag is that if there was a huge spike in GHG’s over a shorter period of time, lets say 5-10 yrs. (which would definitely be the case if permafrost, ocean and forest die off positive feedbacks were to be pushed over their tipping points, thus releasing massive quantities of methane and C02), the global temperature rise would also increase at an exponential rate. Not to mention the fact that methane has a minute time-lag in comparison to C02.
So, a more realistic picture would be: current GHG levels will undeniably rise temperatures past the 1.5C mark in the next 10-15 yrs., pushing the permafrost over its tipping point and hurling it into a rapid positive feedback loop, drastically escalating the already exponential rate of global temperature rise. During (or even possibly before) this short process, every other positive feedback will come into play (this is because they are all just as sensitive to temperature and/or C02 increases as permafrost is) forcing the global temperature to rise beyond any conservatively or reasonably projected model.
What’s really concerning in all this is that the arctic sea ice, permafrost, glaciers and ice caps have already begun their near rapid melt, and we continue to increase our output of fossil fuel GHG emissions and deforest the earth. Does anyone know what more than a 5-7C temperature rise looks like? Near-term extinction for the majority of biological life, including humans. It means that almost all fresh and drinkable water will dry up. It means that the sea levels will rise by roughly 120 meters (394 ft). It means that the current levels of oxygen in the atmosphere right now will become so low that neither I nor you will be able to breath it. This is the part where most people start formulating rebuttals that usually include the word “alarmist!”. Well, if the bare facts of our current situation are not alarming then I would think we have an even bigger problem.
There are two distinct scenarios here that I feel need to be pointed out (most often they are not). The first one goes like this: if we keep destroying the Earth and continue down this path of “business as usual” then the biosphere will collapse and along with it the global economy and ultimately industrial civilization.
The other scenario goes like this: if the destruction perpetuated by industrial civilization is somehow halted, subsequently averting total biosphere collapse, then the global economy and industrial civilization will collapse.
Basically, in the next 10-15 yrs., it is unequivocal that either way the global economy and industrial civilization (all that we who are living within this structure know and rely on) will collapse.
Kind of makes the worry of a national economic recession seem like a bad joke. The question is then: which scenario would you prefer? The near extinction of all life on earth (including your own species), or the end of a really bad experiment in social organization that has almost, but not quite, destroyed the planet?
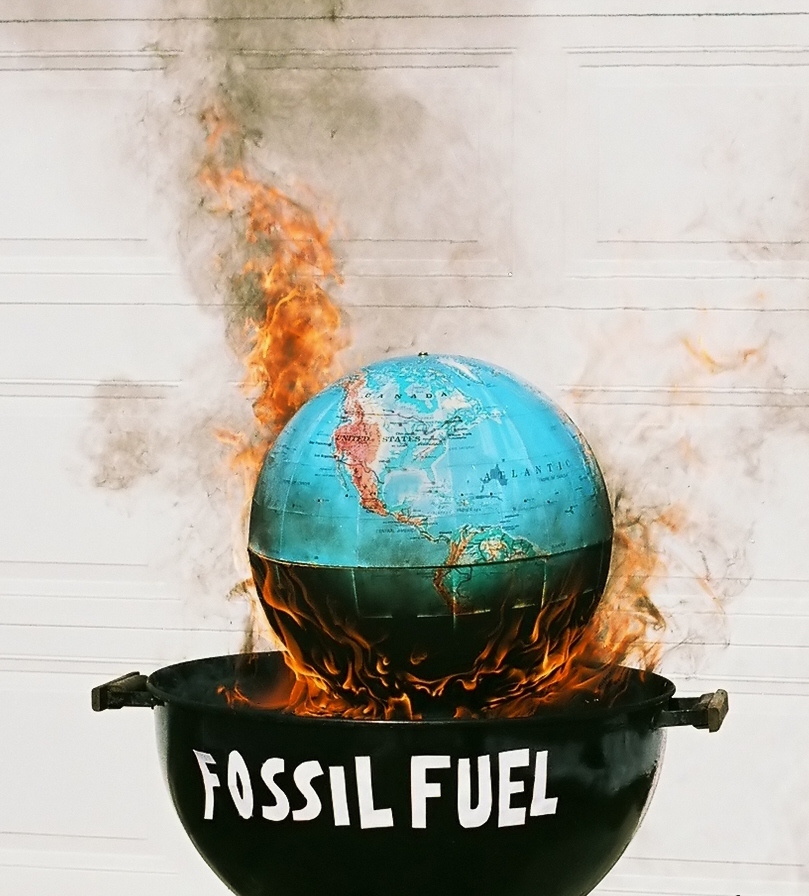
The only chance of survival is to immediately end the consumption of fossil fuels (on all levels and in every way, including well-intentioned “green-energy-solutions” that pump huge amounts of C02 into the atmosphere annually during set-up and production), and to quickly begin sequestering GHG’s from the atmosphere. Best way to end this consumption would be to shut down all fossil fuel extractions, and to lock up all ready-to-be-used fossil fuels: gasoline, coal, stored natural gas, and throw away the key. Best way to sequester the GHG’s (semi-naturally) would be to plant native-to-bioregional plants/trees wherever they had been destroyed, and to grow our own food locally in the parks, on roadways, on rooftops, and on the front/back lawns of every suburban home.
These are our only two options, and we need to do both at the same time. Realistically this means we will need to bring down atmospheric C02 levels to where they were in pre-industrial times. In order to have any certainty of success we must be 50% of the way there by about 2016, and 100% there by 2020.
Yes, things look bad. But it all depends on your perspective. One good thing is that civilization does not represent the whole of humanity, nor does it represent any other species of life on earth. So, on the one hand it doesn’t look too good for civilization if people decide to rise up and end this insanity (which would subsequently be a positive effect on the biosphere and the rest of humanity). But, on the other hand, well…not so good for anyone.
Nevertheless be encouraged, we still have a small window of time in which to succeed!
Overview of Data
Below are dates with projected increases of both C02 and global temperature, along with projected tipping points for major positive feedback loops around the world.
Reasonable Estimation of Temperature Correlation With C02 Levels
These calculations are based only on current levels of C02 and historic corresponding
temperature level values, no future increase of C02, no current or future positive feedbacks.
Current level of C02 395 ppm = 4.5C increase above current temp, average between 3-6C
(2013, 0.8C).
35 year time-lag = 2048 at 4.5C increase
Estimates For C02 Increase
C02 ppm increase at current rate, five year increments
| 2013 |
2018 |
2023 |
2028 |
2033 |
2038 |
2043 |
| 395 |
405 |
415 |
425 |
435 |
445 |
455 |
C02 ppm increase at current rate with increase of fossil fuel consumption and positive feedbacks
| 2013 |
2018 |
2023 |
2028 |
2033 |
2038 |
2043 |
| 395 |
415 |
435 |
455 |
495 |
535 |
575 |
Estimates For Temperature Increase
Temperature based on current trends over past 20 years (without further inputs)
| 2013 |
2020 |
2030 |
2040 |
2050 |
2060 |
| 0.80 |
0.90 |
1.05 |
1.20 |
1.35 |
1.50 |
Temperature increase based on C02 correlation/35 year time lag
| 2013 |
2018 |
2023 |
2028 |
2033 |
2038 |
2043 |
2048 |
| 0.80 |
1.33 |
1.86 |
2.39 |
2.92 |
3.45 |
3.98 |
4.51 |
Temperature increase based on C02 correlation and forcing from positive feedbacks
| 2013 |
2018 |
2023 |
2028 |
2033 |
2038 |
2043 |
2048 |
| 0.80 |
1.45 |
2.23 |
3.04 |
4.06 |
4.88 |
5.90 |
6.90 |
Note:
2050 Conservative estimates based on current trends for major tipping points
2018 Reasonable estimates based on C02 and positive feedbacks for major tipping points
2034 Average between both estimates for major tipping points
Individual Tipping Points for Positive Feedbacks
2016 1.11C increase -Arctic sea ice tipping point (warmer oceans)
2018 1.33C increase -Arctic clathrate tipping point (methane release)
2019 1.43C increase -Greenland and Antarctic ice sheet tipping points (sea level rise)
2020 1.54C increase -Permafrost tipping point (methane release)
2028 455ppm C02 -Ocean acidification tipping point (C02 release) 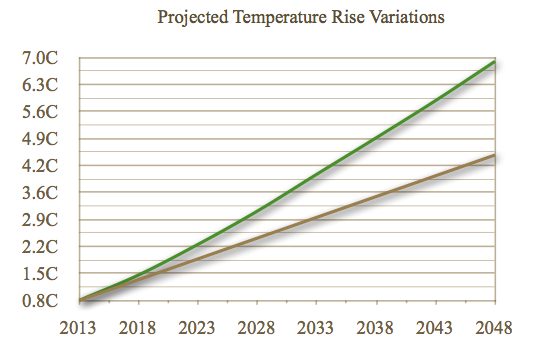
Fig. 1. This shows the variations between projected increases in temperature: bottom line (brown) represents the rate of temperature increase based on the C02 correlation with a 35 year time lag, and top line (green) represents the temperature increase with C02 correlation including forcing from positive feedbacks.
Overview of Concepts in Climate Change
Carbon Dioxide
Carbon dioxide (CO2) is a naturally occurring chemical compound and is a gas at standard temperature/pressure. CO2 exists in Earth’s atmosphere as part of the carbon cycle, emitted through plant and animal respiration, fermentation of liquids, volcanic eruptions as well as various other means. Levels of CO2 concentrations have risen and fallen over the past 3 billion years but with striking clockwork over the last 800 thousand years, rising and falling on a cycle of 40-100 thousand years (Fig. 2).
Ice core data indicate that CO2 levels varied within a range of 180 to 300 ppm over the last 650 thousand years (Solomon et al. 2007; Petit et al. 1999), corresponding with fluctuations from glacial and interglacial periods, with the last interglacial period nearing levels of 290 ppm (Fischer et al., 1999).
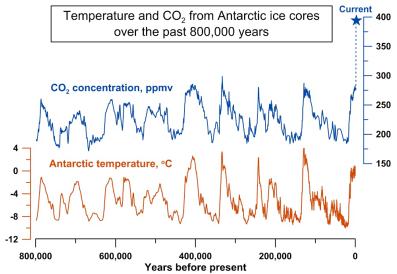
Fig. 2. This is a record of atmospheric CO2 levels over the last 800,000 years from Antarctic ice cores (blue line), and a reconstruction of temperature based on hydrogen isotopes found in the ice (orange line). Concentrations of CO2 in 2012, at 392 parts per million (ppm), from the Mauna Loa Observatory are shown by the blue star at the top (Simple Climate, 2012. Credit to: Jeremy Shakun/Harvard University). https://simpleclimate.wordpress.com/2012/04/04/global-view-answers-ice-age-co2-puzzle/
Near the end of the Last Glacial period, around 13,000 years ago, CO2 levels rose from about 180 ppm to about 260 ppm and leveled off until the Industrial Revolution in the mid 1700’s when it began to climb from 280 ppm (Neftel et al. 1985). While that 260 ppm of CO2 had remained more or less unchanged for the last 10,000 years, roughly since early Civilization, it was the actions of Civilization through the burning of fossil fuels, since the Industrial Revolution, that caused a dramatic increase over the last century (Blunden et al. 2012, S130).
The contribution of Industrial Civilization’s CO2 comes mainly from the combustion of fossil fuels in cars, factories and from the production of electricity and deforestation for timber and agricultural lands. Today the monthly mean concentration levels, (Fig. 3), are around 394 ppm (Recent CO2 readings for 2012 at the Mauna Loa Observatory by the National Oceanic & Atmospheric Administration), increasing about 100 ppm from pre-industrial times in just the last 100 years and currently rising at a rate of 2 ppm each year.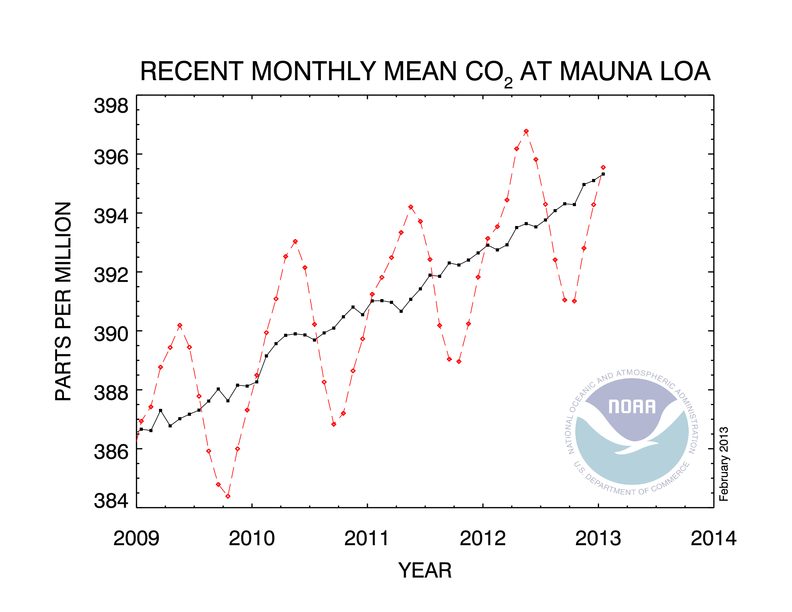
Fig. 3. This table shows monthly mean CO2 measurements for the years 2008 to 2012 from the Mauna Loa Observatory, Hawaii. The dashed red line represents monthly mean values, and the black line is representative of monthly mean values with the correction for average seasonal cycles (NOAA Earth System Research Laboratory, 2012). http://www.esrl.noaa.gov/gmd/ccgg/trends/#mlo_full
Carbon dioxide has a long lifespan once emitted into the atmosphere. “About half of a CO2 pulse to the atmosphere is removed over a time scale of 30 years; a further 30% is removed within a few centuries; and the remaining 20% will typically stay in the atmosphere for many thousands of years.” (Solomon et al. 2007).
Therefore, the amount of CO2 currently in the atmosphere will possibly be persisting long enough to mingle with future emissions that are projected to be higher. Based on CO2 emissions from burning fossil fuels in the year 2000, the IPCC calculated out the possible future increase of emissions if Civilization continued at that current rate of economic and consumer growth (increased fossil fuel consumption). “The projected emissions of energy-related CO2 in 2030 are 40–110 % higher than in 2000” (Solomon et al. 2007).
This could result in an increase of atmospheric CO2 from levels that were 369 ppm at the time, to 516-774 ppm by 2030 (Fig. 4); levels closer to those of the Eocene, 700-900 ppm roughly 54-50 million years ago (Paul N. Pearson 2000), when temperatures were about 5-7 degrees Celsius warmer than today and sea levels were roughly 120 m higher (Sluijs et al. 2008).
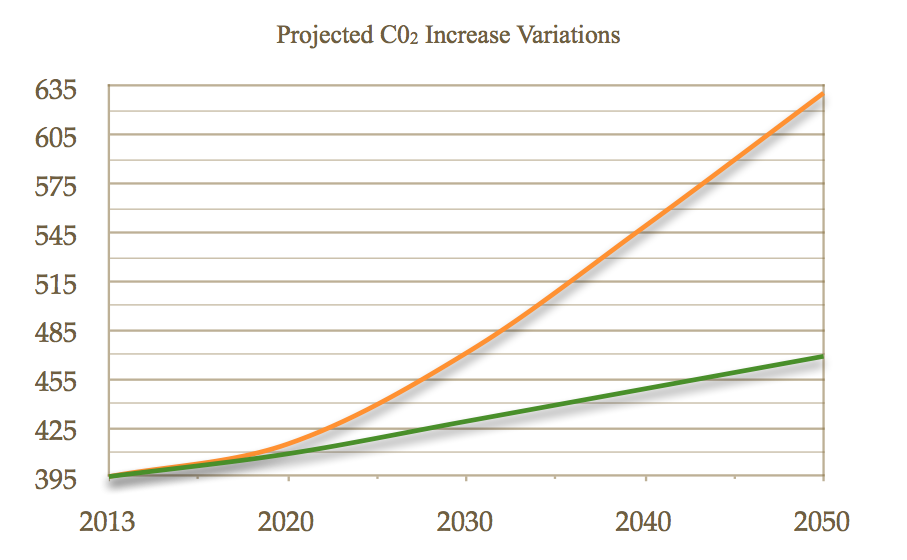
Fig. 4. This table shows the variations between projected C02 increases: bottom line (green) is the current rate of increase at 2ppm/yr. based on previous ten year average, top line (orange) is current rate plus increased Industrial Civilization forcing and positive feedbacks.
Greenhouse Earth
The environmental effects of carbon dioxide are of significant interest. Earth is suitable for life due to its atmosphere that works like a greenhouse. A fairly constant amount of sunlight strikes the planet with roughly 30 percent being reflected away by clouds and ice/snow cover, leaving the uncovered continents, oceans and atmosphere to absorb the remaining 70 percent. Similar to a thermostat, this global control system is set by the amount of solar energy retained by Earth’s atmosphere, allowing enough sunlight to be absorbed by land and water and transforming it into heat, which is then released from the planet’s surface and back into the air as infrared radiation.
Just as in the glass ceiling and walls of a greenhouse, atmospheric gasses, most importantly carbon dioxide, water vapor and methane, trap a fair amount of this released heat in the lower atmosphere then return some of it to the surface. This allows a relatively warm climate where plants, animals and other organisms can exist. Without this natural process the average global temperature would be around -18 degrees Celsius; see more (Solomon et al. 2007).
The current levels of greenhouse gas (GHG) concentrations, principally carbon dioxide (Fig. 3), in the Earth’s atmosphere today are higher and have the potential to trap far more radiative heat than has been experienced within the last 15 million years (Tripati 2009), amplifying the greenhouse effect and raising temperatures worldwide. “The total CO2 equivalent (CO2-eq) concentration of all long-lived GHG’s is currently estimated to be about 455 ppm CO2-eq” (Solomon et al. 2007), as of 2005. These other contributors of GHG’s include methane released from landfills, agriculture (especially from the digestive systems of grazing animals), nitrous oxide from fertilizers, gases used for refrigeration and industrial processes, the loss of forests that would otherwise store CO2, and from the melting of permafrost in the arctic.
According to the IPCC Fourth Assessment Report “These gases accumulate in the atmosphere, causing concentrations to increase with time. Significant increases in all of these gases have occurred in the industrial era”, and the increases have all been attributed to Industrial Civilization’s activities (Solomon et al. 2007).
Historically, through the rise and fall of temperatures over the last 800 thousand years, temperatures have risen first, then CO2 would increase, accelerating even more temperature rise until a maximum when both would then drop, creating a glacial period. Though CO2 levels over this period of time have not been the trigger for temperature rise and interglacial periods, they either have occurred at the same time or have led positive feedback global warming during the stages of deglaciation, greatly amplifying climate variations and increasing the global warming capacity due to the greenhouse effect (Shakun et al. 2012), (Solomon et al. 2007).
What makes the present situation unpredictable to some extent is that never before has CO2 climbed so rapidly and so high, far ahead of temperature. Furthermore, this extra heat-trapping gas released into the atmosphere takes time to build up to its full effect, this is due to the delaying effect of the oceans as they catch up with the temperature of the atmosphere; deep bodies of water take longer to warm. There is a twenty-five to thirty-five year time lag between CO2 being released into the atmosphere and its full heat-increasing potential taking effect.
This means that most of the increase of global temperature rise observed thus far has not been caused by current levels of carbon dioxide but by levels that already have been in the atmosphere before the 1980’s. What is troublesome here is that these last three decades since then have seen the levels of greenhouse gases increase dramatically. On top of the current temperature rise we see now there is already
roughly another thirty years of accelerated warming built into the climate system.
There are many other Civilizational factors that contribute to this global rise in temperature outside of GHG’s. While these extra factors do supply further warming and are just as serious a threat to a semi-stable climate, they are not as long lasting.
One of the most notable of these, being the second largest Civilizational contributor to global temperature rise, is black carbon (BC), also called soot (T. C. Bond et al 2013). The greatest sources of BC are the incomplete burning of biomass (forest and savanna burning for agricultural expansion) and unfiltered diesel exhaust for transportation and industrial uses (Ramanathan and Carmichael 2008). There is a two fold warming effect from the BC.
First, the dark particles of this soot absorb incoming heat from solar radiation and directly heat the surrounding air, though only for a short period of time. Secondly, the soot particles in the air, once carried from their point of origin, are increasingly falling on snow and ice changing these reflective surfaces into absorptive ones, decreasing the albedo (reflectivity). Therefore, BC deposits have increased the melting rate of snow and ice.The most alarming of these effects can be seen on glaciers, ice sheets and the arctic sea ice (T. C. Bond et al 2013). While reductions in BC would have immediate but not long lasting effects on temperature rise, it would increase the chances of averting further warming
Nevertheless, the projected rise due to the continued increase in levels of GHG’s will not be prevented without
reducing overall emissions.
Temperature
The Earth is warming and this time the trend is far from natural. The average temperature of the Earth’s surface has risen by 0.8 degrees Celsius since the late 1800s (Fig. 4). On a geologic timescale this swift increase is alarming. When temperatures have risen in the past, warming the planet at several points between ice ages, the average length of time this process has taken is roughly 5,000 years to increase global temperatures by 5 degrees.
In this past century alone the temperature has risen ten times the average rate of ice age recovery warming, a recent trend not only driven by the rise of atmospheric CO2 concentrations, but also amplified by them.
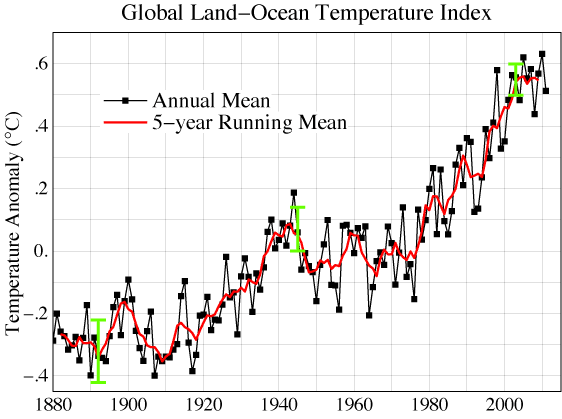
Fig. 4. This table shows global temperature anomaly from 1880 through to 2011. Black lines are representative of annual mean variances and the red line is representative of five year running temperature mean’s. (NASA Goddard Institute for Space Studies, 2012) http://data.giss.nasa.gov/gistemp/2011/Fig2.gif
Continued economic, global population and energy consumption growth over the next few decades will consequently increase not only CO2 emissions, but also the rate and quantity with which they accumulate in the atmosphere. This is a business-as-usual scenario where efforts to reduce greenhouse gas emissions, namely CO2, have fallen short of any earnest mitigation, “locking in climate change at a scale that would profoundly and adversely affect all of human Civilization and all of the world’s major ecosystems” (Allison et al. 2009); see scenario A1FI (Fig. 5).
Even if the global mean temperature only rises another 2 degrees before the end of this century, it would be a larger increase in temperature rise than any century-long trend in the last 10,000 years. A one degree global temperature rise is also significant for the reason that it takes a vast amount of heat to warm all the oceans, atmosphere, and land by that much; even more so is the significance of subsequent ecosystem collapse in climate sensitive areas such as the Arctic due to such a rise.
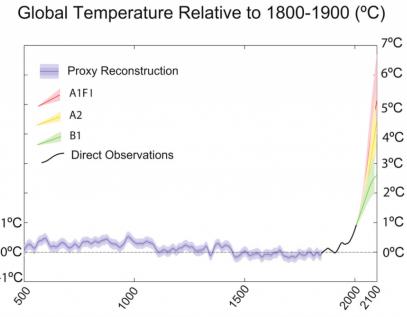
Fig. 5. This is a reconstruction of global average temperatures relative to 1800-1900 (blue), observed global average temperatures since 1880 to 2000 (black), and projected global average temperatures out to 2100 within three scenarios (green, yellow and red), (Allison et al. 2009). Scenario A1FI, adopted from the IPCC AR4 2007 report, represents projections for a continued global economic growth trend, and a continued aggressive exploitation of fossil fuels; the FI stands for “fossil fuel intensive”. http://www.ccrc.unsw.edu.au/Copenhagen/Copenhagen_Diagnosis_HIGH.pdf
Arctic Warming
The greatest changes in temperature over the last hundred years has been in the northern hemisphere, where they have risen 0.5 degrees Celsius higher since 1880 than in the southern hemisphere (Fig. 6). The Arctic is experiencing the fastest rate of warming as its reflective covering of ice and snow shrinks and even more in sensitive polar regions.
One of the main facets that are being affected by the increase of temperature in the Arctic is the potential collapse of Arctic ecosystems that succeed in the region. Ecosystems that are under pressure and that are at their tipping points can be defined as having their thresholds forced beyond what they can cope with. Different components of ecosystems experience diverse changes. In this instance,
“ecosystem tipping features” refers to the components of the ecosystem that show critical transitions when experiencing abrupt change (Duarte et al. 2012).
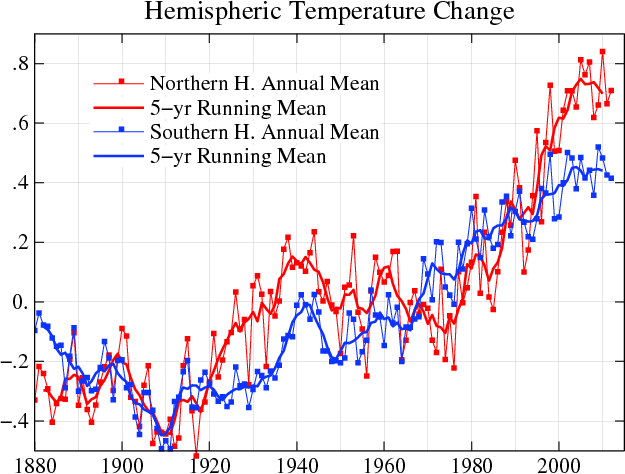
Fig. 6. This table shows both annual and five year mean temperature variances between 1880 and 2011. Temperature mean averages for the northern hemisphere are in red and southern hemisphere averages are in blue (NASA Goddard Institute for Space Studies, 2012). http://data.giss.nasa.gov/gistemp/graphs_v3/Fig.A3.gif
Sea Ice Loss
The significance of sea ice loss in the Arctic relates to a serious tipping point in the Arctic marine ecosystem which is given by the temperature at which water changes state from solid to liquid. Ice responds suddenly to changes at this temperature. This causes warming and loss of sea ice to amplify the potential changes to the climate including a reduction in albedo with the declining sea ice. Crossing the tipping point sets in motion many changes that further increases temperature in the Arctic region on top of current global warming (Duarte et al. 2012).
The ice that encompasses the Arctic has slowly been dwindling ever since a catastrophic collapse in the Arctic region in 2007. Since that point, close to two thirds of the ice has vanished compared to a decade earlier when the loss of sea ice was significantly smaller (Anderson, 2009). Scientists had previously predicted that the ice in the Arctic region would not be reduced to the point that it reached in 2007 until at least 2050, and in 2012 it dropped to levels much lower than in 2007 (Fig. 7). It is now predicted that the Arctic summer ice could disappear entirely as early as 2013.
The vulnerable setting of the Arctic region has certainly made it easy for global warming to have significant influences on the natural climate processes. The white ice naturally reflects sunlight back into space, but with the melting of the ice and subsequent open, dark sea water, the reflectivity is reduced and therefore the heat is retained instead. The arctic seas warm up, melting more ice, and then even more is absorbed and melted by the increasing water temperature change. This creates a dangerous feedback loop that intensifies melting and overall temperatures.
Observations and climate models are in agreement that through the 21st century, Arctic sea ice extent will continue to decline in response to fossil fuels being burnt and greenhouse gases being released into the atmosphere. Through the influxes of heat being circulated, temperature for the terrestrial and aquatic systems continues to increase, delaying ice growth during winter and autumn only to increase the temperature on the region.
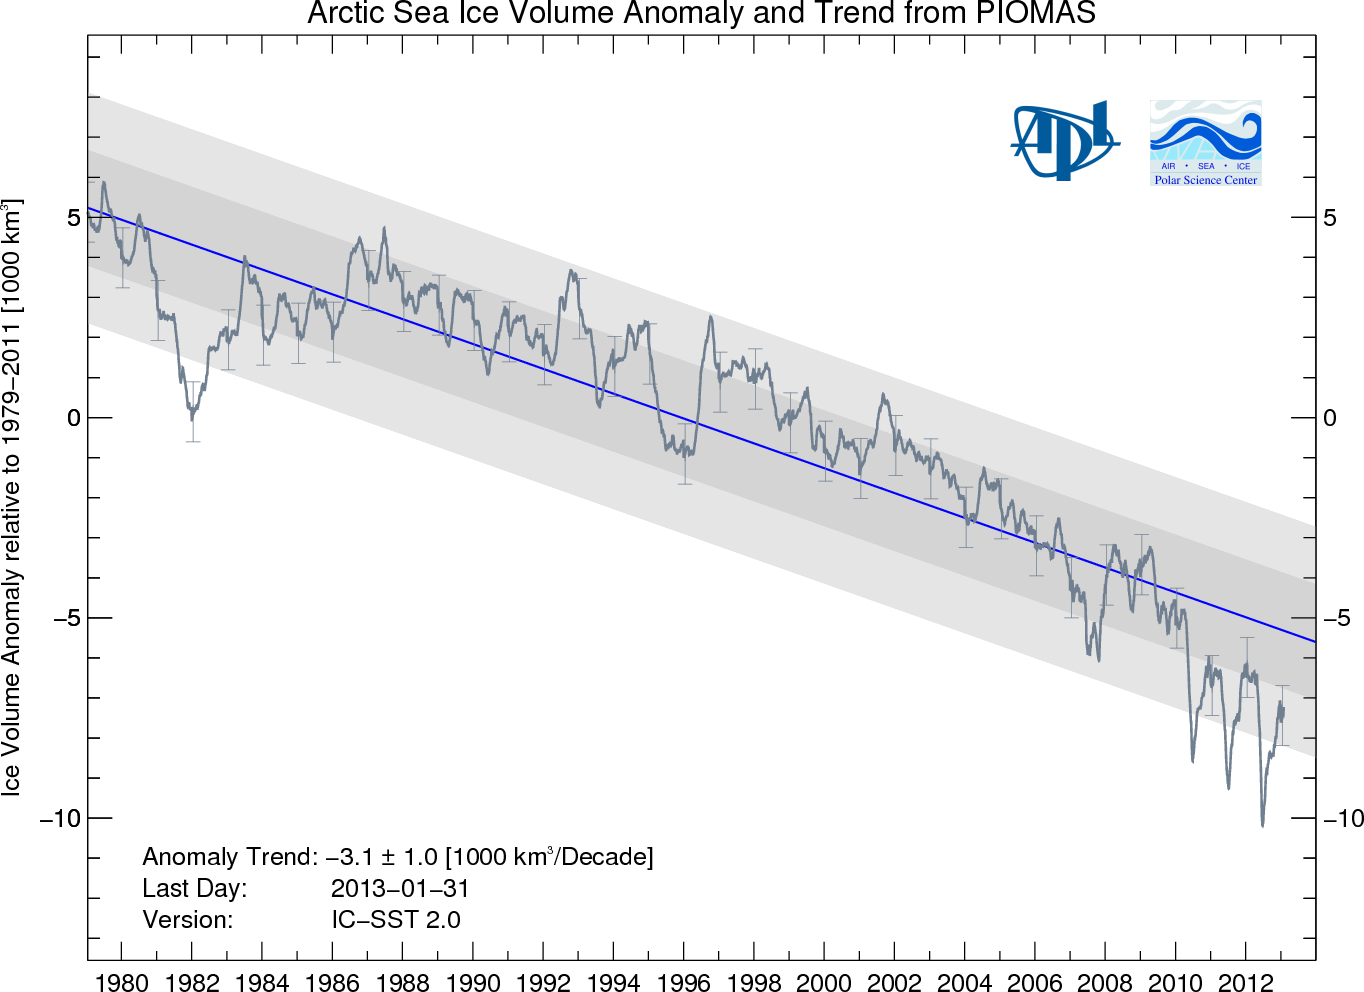
Fig. 7. This table shows the ice volume anomalies of the Arctic ocean, with respect to the volume of ice over a period between 1979 to 2011. (Polar Science Center, psc.apl.washington.edu. 2011) http://psc.apl.washington.edu/wordpress/wp-content/uploads/schweiger/ice_volume/BPIOMASIceVolumeAnomalyCurrentV2.png?%3C%3Fphp+echo+time%28%29
Permafrost Melt
One of the most worrisome scenarios of a positive feedback is the thawing of huge quantities of organic material locked in frozen soil beneath Arctic landscapes. Vast quantities of carbon and methane from once rotting vegetation are stored in the frozen soil. This frozen soil is called permafrost and it contains significantly more carbon than is currently in the atmosphere.
Permafrost is defined as subsurface Earth materials remaining below 0°C for two consecutive years. It is thoroughly widespread in the Northern Hemisphere where permafrost regions occupy 22% of the land surface (Schuur et al. 2008).
The temperature, thickness and geographic continuity of permafrost are controlled by the surface energy balance. Permafrost thickness geographically ranges from 1 meter to 1450 meters depending on where the permafrost is situated. The layer that thaws in the summer and refreezes in the winter is referred to as the active layer. The thickness of the active layer ranges between 10 centimeters and 2 meters. Beneath the active layer is the transition zone, the buffer between the active layer and the more stable permafrost. The thickness of the active layer is significant because it influences plant rooting depth, hydrological processes, and the quantity of organic soil matter uncovered to the above-freezing seasonal temperatures. The growing concern is that permafrost’s relationship with the Arctic warming could lead to drastic changes for the region.
The processes that involve the transfer of stored carbon into the atmosphere have the potential to significantly increase climate warming in the Arctic region (Schuur et al. 2008). Since it only would take a few more degrees in temperature rise to tip the permafrost into rapid thawing and subsequently release huge amounts of stored carbon and methane, methane being over 20x as potent a greenhouse gas, this would result in a much larger feedback into the global GHG level rise.
A Warmer World
Industrial Civilization is on a path to heat the Earth up by 4 to 7 degrees Celsius before the middle of this century if it fails to end its carbon emissions, triggering a cascade of cataclysmic changes that will include the increase of extreme heat-waves, prolonged droughts, intensified weather patterns, the total loss of Arctic sea ice, rapid decline in global food availability, sea level rise affecting billions of people, and eventually an abrupt extinction of the majority of biological life on earth.
The solution, while not a simple one to execute, is clear: Industrial Civilization must end its reliance on fossil fuels and begin to sequester CO2 from the atmosphere immediately, reducing the atmospheric concentration of CO2 down to a safe level.
A full reference list for this article is available here: http://dgrnewsservice.org/newsservice/2013/03/reference-material1.pdf


