by Deep Green Resistance News Service | Apr 26, 2013 | Mining & Drilling
By Max Wilbert / Deep Green Resistance Great Basin
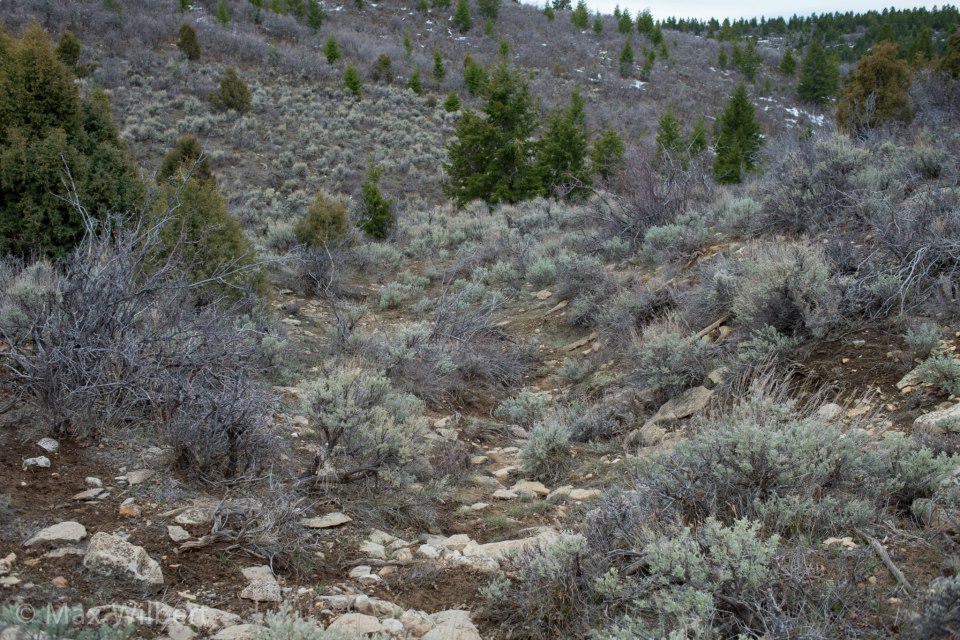
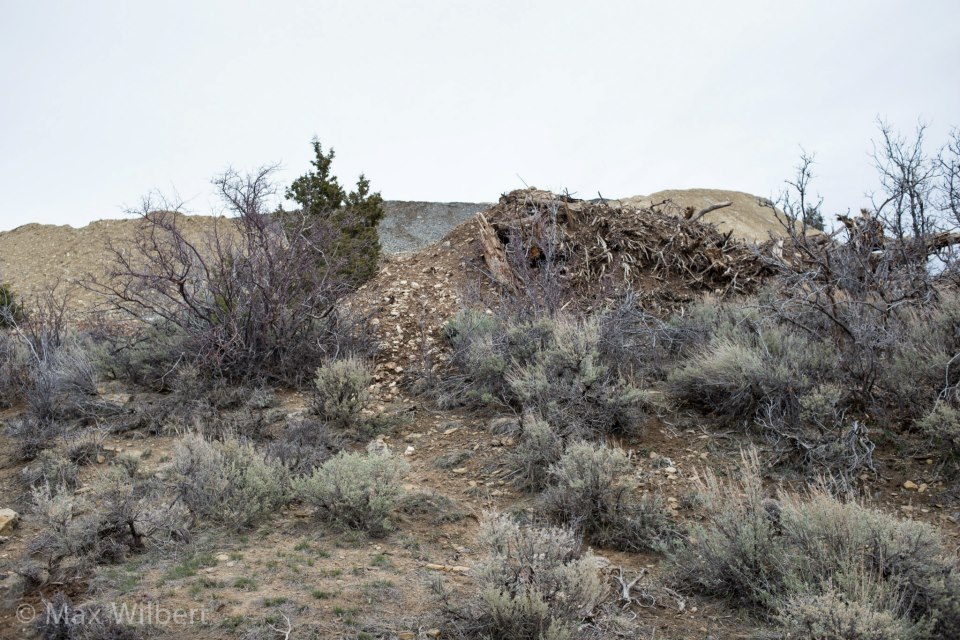
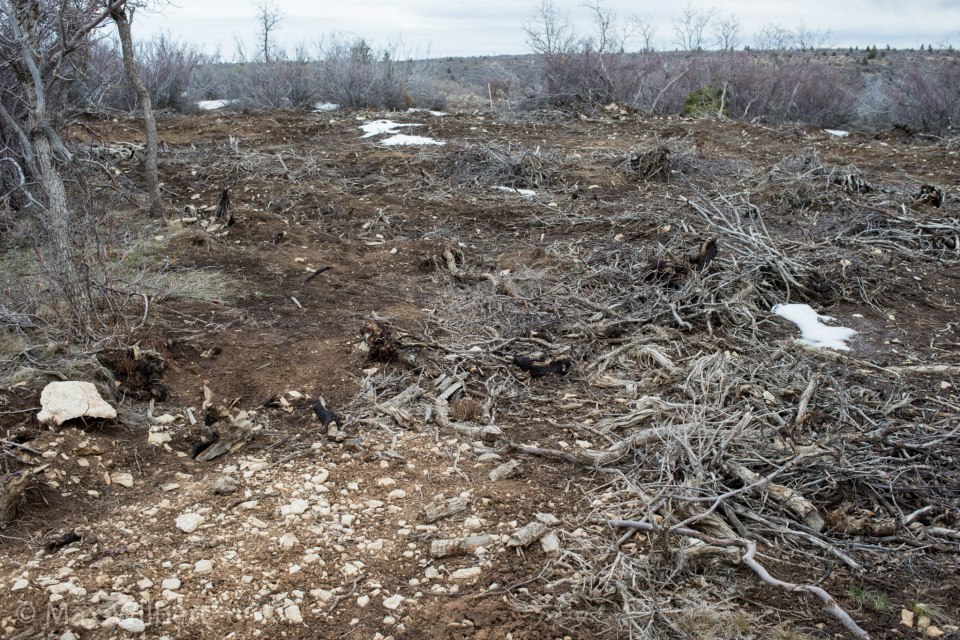
The first Tar Sands mine in the United States is an open wound on the landscape: a three acre pit, the bottom puddled with water and streaked with black tar. Berms of broken earth a hundred feet tall stand on all sides. To the north and south, Seep Ridge Road – a narrow, rutted, dirt affair – is in the midst of a state-funded transfiguration into a 4-lane paved highway that may soon be clogged with afternoon traffic jams of oil tankers and construction equipment. Clearcuts and churned soil stretch to either side of the road, marking the steady march of progress.
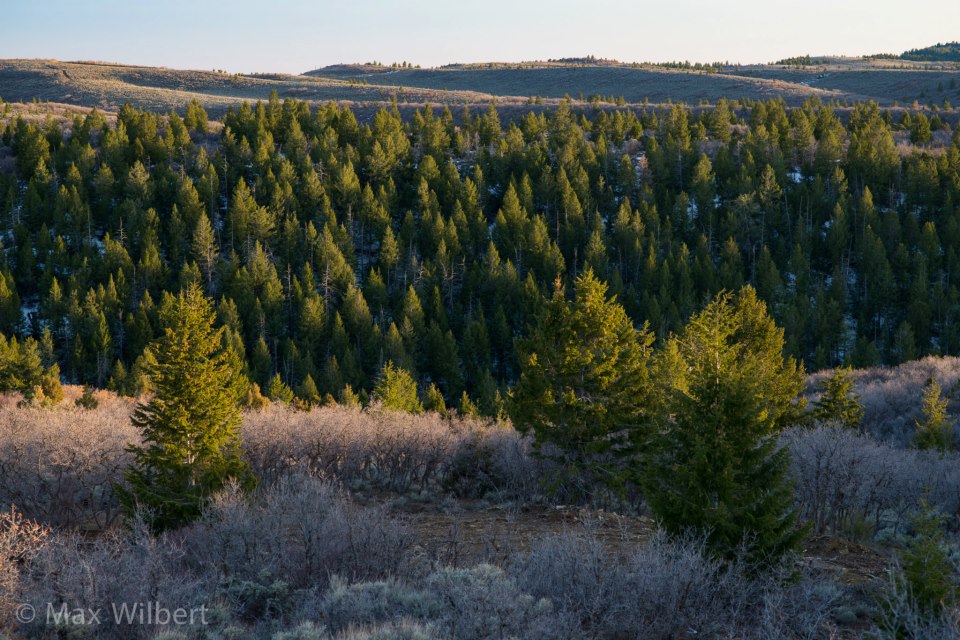
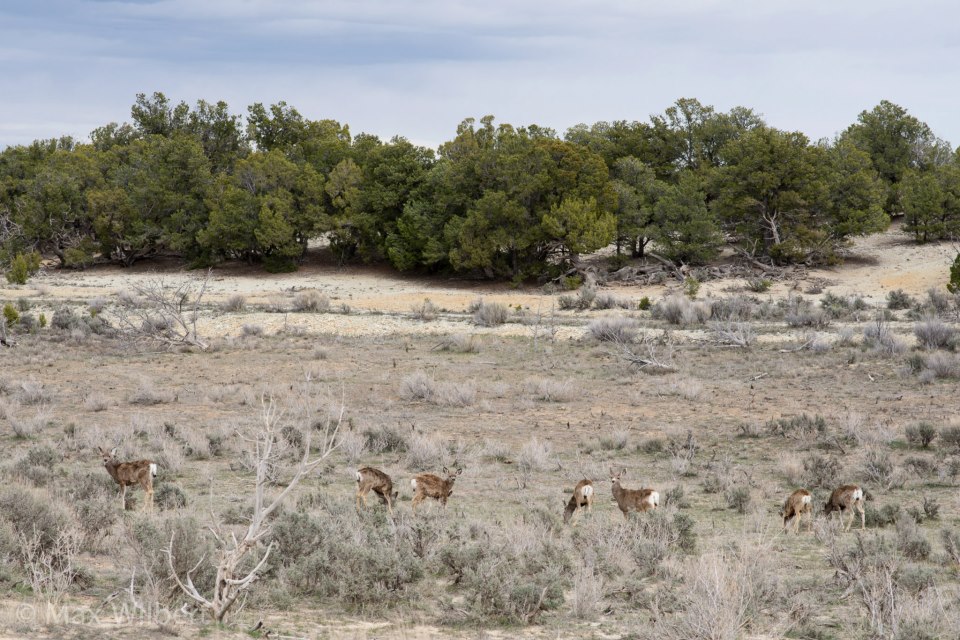
This is the Uintah Basin of eastern Utah – a rural county, known for providing the best remaining habitat in the state for Rocky Mountain Elk, White Tailed Deer, Black Bear, and Cougar. In the last decade, it’s become the biggest oil-extraction region on the state, and in the last five years fracking has exploded. There are over 10,000 well pads in the region. And now, the Tar Sands are coming.
Thirty two thousand acres of state lands situated on the southern rim of the basin – some 50 square miles – have been leased for Tar Sands extraction. If all goes according to plan, the mine at PR Springs that I’m looking at would produce 2,000 barrels of oil per day by late this year, with planned increases to 50,000 barrels per day in the future.
Dozens of similar mines are planned across the whole region. Along with their friends in state and local governments, energy corporations are collaborating to turn this region into an energy colony – a sacrifice zone to the gods of progress, growth, and desecration.
Twelve to 19 billion barrels of recoverable tar sands oil is estimated to be located under the rocky bluffs of eastern Utah, mostly in the southern portion of Uintah County. It’s a drop in the bucket for global production, but it means total biotic cleansing for this land.
Crude oil, tar sands, oil shale, and fracking: these are the wages of a dying way of life, and the ozone pollution that is already reaching record levels in this remote, sparsely-populated region is evidence of the moral bankruptcy of this path. There is no claim to morality in this path. It leads only to death, for us and for all life.
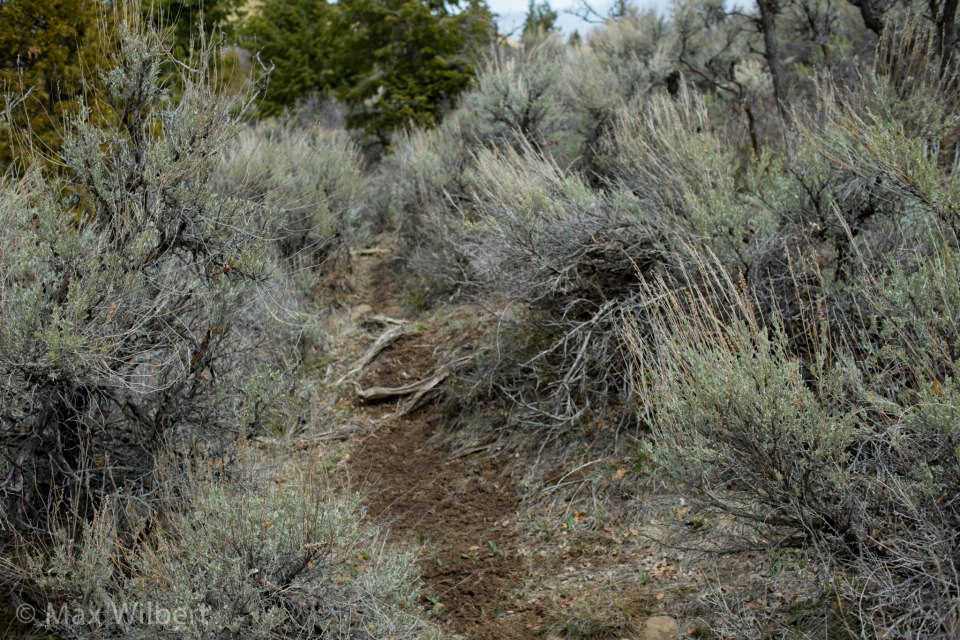
Alongside the test pit and scattered throughout the landscape, drill pads for seismologic assessment and roads to the pads have already been cut through the forests and shrubs, leaving behind a patchwork of shattered sagebrush and mangled juniper – testament to the Earth-crushing consequences of this “development”.
Situated at 8,000 feet of elevation, this wild region is called the Tavaputs Plateau. Unmarked, often muddy dirt roads make travel dangerous, and deep valleys plunge thousands of feet to the rivers that drain the region – the White River to the north, and the Green to the west. Both flow into the Colorado River, which provides drinking water for more than 11 million people downstream.
Resistance to tar sands and oil shale projects in Utah dates at least back to the 1980’s, when David Brower and other alienated conservationists fought off the first round of energy projects in this region. Thirty years later, the fight is on again.
It is likely that the PR Springs mine will be the bellwether of Tar Sands mining in the United States. If the project is stopped, it will be a major blow to the hopes of the Tar Sands industry in this country, while if it goes ahead smoothly, it may open the floodgates for more projects in Utah, Colorado, and Wyoming.
That is why resistance to this project is so important. That resistance is building. Strong organizations based in Moab (Before it Starts and Living Rivers) and Salt Lake City (Utah Tar Sands Resistance and Peaceful Uprising) are working together to organize against the project, and individuals and allies have been scouting the site and preparing to take action this summer.
Campouts at PR Springs will take place in May and June with more gatherings likely throughout the summer. An action camp will take place the fourth week of July, with activists and concerned people from across the country gathering to support one another, prepare for action, and make plans. All are welcome.
Time is short. There is no time to waste, and we are few. If we are to succeed, we will need your help, your solidarity.
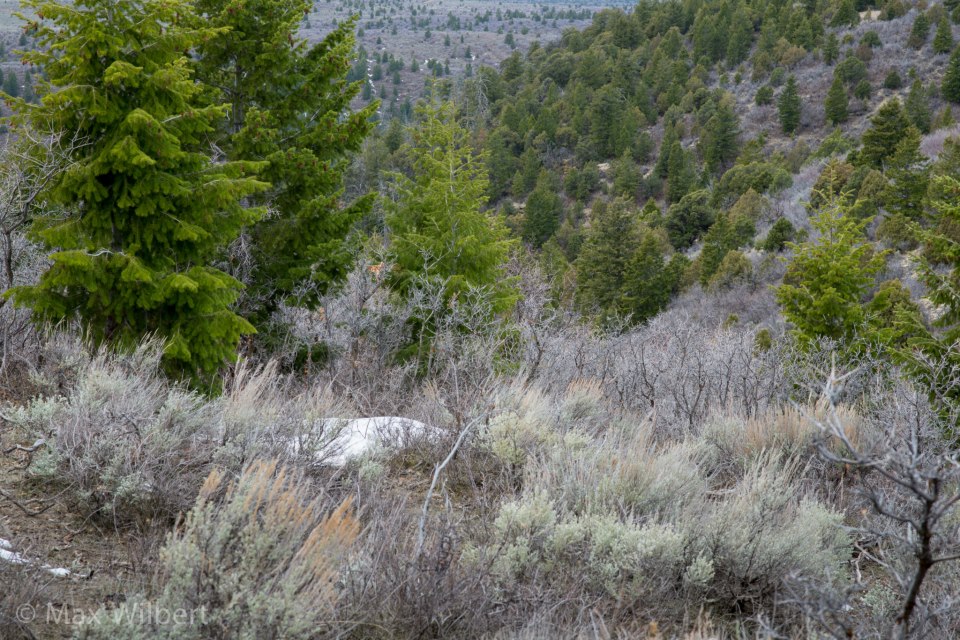
Looking out across a landscape that might soon be a wasteland, my gaze wanders across the juniper, scrub oak, and sagebrush that wrap gently over the hillsides and drop into the valleys. The setting sun casts waning light on the treetops, and a small herd of Elk climbs a ridge in the distance and disappears into the brush. Overhead, the few clouds in the broad sky fade from red to deep purple, then to darkness.
The last birds of the day sing their goodnight songs, and the stars begin to appear, thousands of them, lighting up the night sky and casting a dull glow across the countryside. I take a deep breath, tasting the cool night air spiced with the scents of the land.
The bats are out, flitting about snatching tasty morsels out of midair. I can hear their voices. They are calling to me. Tiny voices carrying across miles to whisper in your ear like the tickle of a warm breeze. “Fight back,” they say. “Please, fight back. This is our home. We need you to do what it takes to stop this. Whatever it takes to stop this. Whatever it takes.”
Whatever it takes.
_____________________________________________________
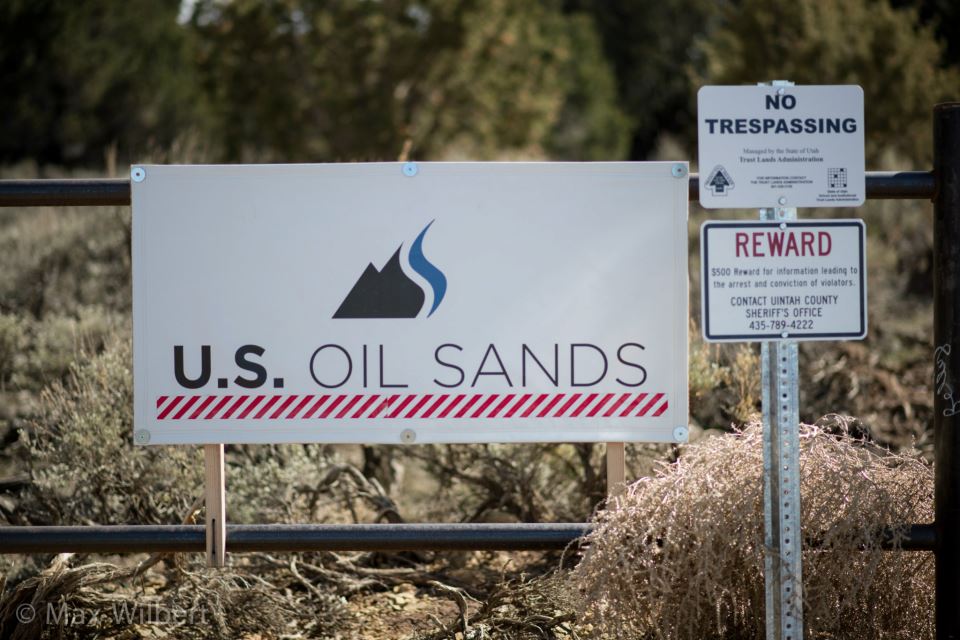
Companies involved in Tar Sands projects in the Utah include Red Leaf Resources (which also works in the Oil Shale business and is based in Salt Lake City), MCW Energy Group, Crown Asphalt Ridge LLC, and U.S. Oil Sands, a Calgary, Alberta based company.
Red Leaf Resources is currently working on a shale oil operation in the same region as the PR Springs mine, which could eventually produce 10,000 barrels of oil per day. Other large oil shale operations are planned for region by the Estonian company Enefit.
You can learn more about the resistance to Utah Tar Sands projects at the following websites:
http://www.tarsandsresist.org/
http://www.peacefuluprising.org/topic/current-campaigns/stop-tar-sands


Max Wilbert is a writer and community organizer living in occupied Goshute territory otherwise known as Salt Lake City, UT. He originally hails for occupied Duwamish territory known as Seattle, and organizes primarily with the Great Basin Chapter of Deep Green Resistance to fight injustice and promote strategies towards the dismantling of industrial civilization.
You can contact Max Wilbert at greatbasin@deepgreenresistance.org
by Deep Green Resistance News Service | Apr 25, 2013 | Biodiversity & Habitat Destruction, Climate Change, Mining & Drilling, Toxification
By Max Wilbert / Deep Green Resistance Great Basin
On April 19th, myself and other organizers from the Salt Lake City community attended the Morning Energy Update, a meeting hosted by the Utah State Office of Energy Development. The meeting was held in a small conference room at the World Trade Center Utah building.
The room was full – us five or six activists mixed in with energy industry businesspeople, State and County officials, and one or two journalists. I sat next to Cody Stewart, the energy advisor to Gary Herbert, the Governor of the State of Utah.
The main topic of the meeting was the development of Oil Shale in eastern Utah, in Uintah and Grand Counties – areas already hard hit by oil and gas extraction and threatened with Tar Sands extraction.
Rikki Hrenko, the CEO of Enefit American Oil (an Estonian shale oil corporation) was the keynote. She presented about the “economic sustainability” and moderate environmental impact of the project.
I responded with the following statement:
http://picosong.com/FkPw/
Any claims about oil shale having a low impact are simply ridiculous – we are talking about strip mining a vast area of wild lands in the watershed of the Colorado, whose water is already so taxed by cities and agriculture that the river never reaches the ocean. Instead, it simply turns into a stream, then a trickle, then cracked mud for the last 50 miles.
The WorldWatch Institute states that oil shale is simply an awful idea:
“Studies conducted so far suggest that oil shale extraction would adversely affect the air, water, and land around proposed projects. The distillation process would release toxic pollutants into the air—including sulfur dioxide, lead, and nitrogen oxides. Existing BLM analysis indicates that current oil shale research projects would reduce visibility by more than 10 percent for several weeks a year. And NRDC states that in a well-to-wheel comparison, greenhouse gas (GHG) emissions from oil shale are close to double those from conventional crude, with most of them occurring during production. According to the Rand Corporation, producing 100,000 barrels of oil shale per day would emit some 10 million tons of GHGs.
The BLM reports that mining and distilling oil shale would require an estimated 2.1 to 5.2 barrels of water for each barrel of oil produced—inputs that could reduce the annual flow of Colorado’s White River by as much as 8.2 percent. Residues that remain from an in-situ extraction process could also threaten water tables in the Green River Basin, the agency says.
NRDC notes that the infrastructure needed to develop oil shale would impose equally serious demands on local landscapes. The group warns that impressive arrays of wildlife would be displaced as land is set aside for oil shale development. And it says that while open pit mining would scar the land, in-situ extraction would require leveling the land and removing all vegetation.
In addition to the environmental impacts of oil shale, vast amounts of energy are required to support production. In Driving it Home, NRDC cites Rand Corporation estimates that generating 100,000 barrels of shale oil would require 1,200 megawatts of power—or the equivalent of a new power plant capable of serving a city of 500,000 people. Proponents of oil shale have a stated goal of producing one million barrels of the resource per day.”
by Deep Green Resistance News Service | Apr 24, 2013 | Indigenous Autonomy, Mining & Drilling, Toxification
By Thistle Pettersen and Beth Ulion / Deep Green Resistance
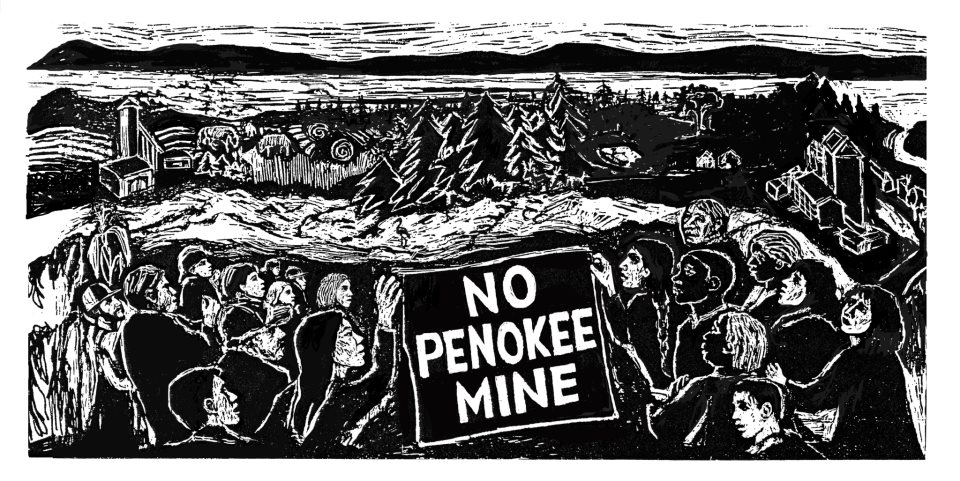
A proposed iron mining effort would create the largest open pit mine in the world in northern Wisconsin.The 22,000 acres of mountain-top removal-style strip mining would potentially dump millions of tons of waste rock into the headwaters of the Bad River, polluting everything downstream including beautiful Copper Falls State Park, the Bad River Ojibwe Reservation, crucial wetland Kakagon Sloughs, and Lake Superior.
Many local residents fear that the huge mine will eat into nearby sulfide-mineral deposits, causing sulfuric acid mine drainage to leach into the surrounding watershed for decades.
The Wisconsin State legislature recently slashed environmental regulations in an attempt to make an easier entry for Gogebic Taconite (G-Tac), a Florida-based company owned by the Cline Group, is also well known for its coal mining operations in Illinois and West Virginia.
This is just one struggle in a worldwide battle against extreme resource extraction – but this time, it’s one we can win. Activists have a good head start, and there is a lot of dedicated support for those who are planning to occupy the Penokee Hills to deliver a message to G-Tac: we are drawing a line in the sand, and they will not be allowed one inch of this sacred land.
Bad River Tribal members are asking for solidarity from allies all over the Great Lakes Region.
Activists will gather at the Central Wisconsin Action Camp May 17-19th in Stevens Point, WI.
This is a great opportunity to meet others from around Central and South Wisconsin and throughout the midwest, and build direct-action skills for this historic struggle.
The crew organizing this event could really use a little help, too! Especially for those of you who are in or near Stevens Point or Madison, assistance in organizing logistics like camp setup, food, etc, as well as additional skill trainings, are greatly appreciated!
As capacity may be somewhat limited, and with the intention of building a solid group of anti-mining activists who can move into the future together, organizers are asking that you please register on the website:
centralwiactioncamp.wordpress.com
centralwiactioncamp@gmail.com
If you are unable to make it to the action camp, you can still plug in by traveling even farther north the following weekend, May 24th-26th for a benefit variety show and camp out at Copper Falls State Park. The variety show fund raiser will be at the Bad River Lodge and Casino on Friday night, the 24th. Money raised at this community-building event will go towards the Penokee Hills Education Project to defend the land from harmful mining. The Red Cliff hoop dancers, Thistle and Thorns, and Barbara With are all acts on this bill that will make it a very special night of performances and comradeship with locals.
The campout is being organized by members of the Bad River Tribe and will include tours of the land where the mine is slated to be put in. Mike Wiggins, chair of the Bad River, will greet and spend time with campers. It will be a beautiful and educational weekend in the great north woods!
If you are interested in attending either of these two weekends or both of them, please contact DGR member Thistle Pettersen to plug into ride shares happening from Madison. thistle@riseup.net.
by Deep Green Resistance News Service | Apr 11, 2013 | Agriculture, Building Alternatives, Colonialism & Conquest, Indigenous Autonomy, Protests & Symbolic Acts
By Imani Altemus-Williams / Waging Nonviolence
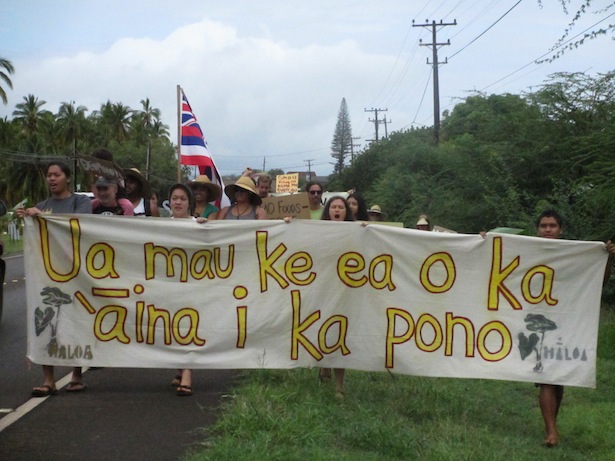
At 9 am on an overcast morning in paradise, hundreds of protesters gathered in traditional Hawaiian chant and prayer. Upon hearing the sound of the conch shell, known here as Pū, the protesters followed a group of women towards Monsanto’s grounds.
“A’ole GMO,” cried the mothers as they marched alongside Monsanto’s cornfields, located only feet from their homes on Molokai, one of the smallest of Hawaii’s main islands. In a tiny, tropical corner of the Pacific that has warded off tourism and development, Monsanto’s fields are one of only a few corporate entities that separates the bare terrain of the mountains and oceans.
This spirited march was the last of a series of protests on the five Hawaiian islands that Monsanto and other biotech companies have turned into the world’s ground zero for chemical testing and food engineering. Hawai’i is currently at the epicenter of the debate over genetically modified organisms, generally shortened to GMOs. Because Hawai’i is geographically isolated from the broader public, it is an ideal location for conducting chemical experiments. The island chain’s climate and abundant natural resources have lured five of the world’s largest biotech chemical corporations: Monsanto, Syngenta, Dow AgroSciences, DuPont Pioneer and BASF. In the past 20 years, these chemical companies have performed over 5,000 open-field-test experiments of pesticide-resistant crops on an estimated 40,000 to 60,000 acres of Hawaiian land without any disclosure, making the place and its people a guinea pig for biotech engineering.
The presence of these corporations has propelled one of the largest movement mobilizations in Hawai’i in decades. Similar to the environmental and land sovereignty protests in Canada and the continental United States, the movement is influenced by indigenous culture.
“All of the resources that our kapuna [elders] gave to us, we need to take care of now for the next generation,” said Walter Ritte, a Hawai’i activist, speaking in part in the Hawaiian indigenous language.
“That is our kuleana [responsibility]. That is everybody’s kuleana.”
In Hawaiian indigenous culture, the very idea of GMOs is effectively sacrilegious.
“For Hawaii’s indigenous peoples, the concepts underlying genetic manipulation of life forms are offensive and contrary to the cultural values of aloha ‘ʻāina [love for the land],” wrote Mililani B. Trask, a native Hawaiian attorney.
Deadly practices
Monsanto has a long history of making chemicals that bring about devastation. The company participated in the Manhattan Project to help produce the atomic bomb during World War II. It developed the herbicide “Agent Orange” used by U.S. military forces during the Vietnam War, which caused an estimated half-million birth deformities. Most recently, Monsanto has driven thousands of farmers in India to take their own lives, often by drinking chemical insecticide, after the high cost of the company’s seeds forced them into unpayable debt.
The impacts of chemical testing and GMOs are immediate — and, in the long-term, could prove deadly. In Hawaii, Monsanto and other biotech corporations have sprayed over 70 different chemicals during field tests of genetically engineered crops, more chemical testing than in any other place in the world. Human studies have not been conducted on GMO foods, but animal experiments show that genetically modified foods lead to pre-cancerous cell growth, infertility, and severe damage to the kidneys, liver and large intestines. Additionally, the health risks of chemical herbicides sprayed onto GMO crops cause hormone disruption, cancer, neurological disorders and birth defects. In Hawaii, some open-field testing sites are near homes and schools. Prematurity, adult on-set diabetes and cancer rates have significantly increased in Hawai’i in the last ten years. Many residents fear chemical drift is poisoning them.
Monsanto’s agricultural procedures also enable the practice of monocropping, which contributes to environmental degradation, especially on an island like Hawai’i. Monocropping is an agricultural practice where one crop is repeatedly planted in the same spot, a system that strips the soil of its nutrients and drives farmers to use a herbicide called Roundup, which is linked to infertility. Farmers are also forced to use pesticides and fertilizers that cause climate change and reef damage, and that decrease the biodiversity of Hawai’i.
Food sovereignty as resistance
At the first of the series of marches against GMOs, organizers planted coconut trees in Haleiwa, a community on the north shore of Oahu Island. In the movement, protesting and acting as caretakers of the land are no longer viewed as separate actions, particularly in a region where Monsanto is leasing more than 1,000 acres of prime agricultural soil.
During the march, people chanted and held signs declaring, “Aloha ‘āina: De-occupy Hawai’i.”
The phrase aloha ‘āina is regularly seen and heard at anti-GMO protests. Today the words are defined as “love of the land,” but the phrase has also signified “love for the country.” Historically, it was commonly used by individuals and groups fighting for the restoration of the independent Hawaiian nation, and it is now frequently deployed at anti-GMO protests when people speak of Hawaiian sovereignty and independence.
After the protest, marchers gathered in Haleiwa Beach Park, where they performed speeches, music, spoken-word poetry and dance while sharing free locally grown food. The strategy of connecting with the land was also a feature of the subsequent protest on the Big Island, where people planted taro before the march, and also at the state capitol rally, where hundreds participated in the traditional process of pounding taro to make poi, a Polynesian staple food.
The import economy is a new reality for Hawaii, one directly tied to the imposition of modern food practices on the island. Ancient Hawai’i operated within the Ahupua’a system, a communal model of distributing land and work, which allowed the islands to be entirely self-sufficient.
“Private land ownership was unknown, and public, common use of the ahupua’a resources demanded that boundaries be drawn to include sufficient land for residence and cultivation, freshwater sources, shoreline and open ocean access,” explained Carol Silva, an historian and Hawaiian language professor.
Inspired by the Ahupua’a model, the food sovereignty movement is building an organic local system that fosters the connections between communities and their food — a way of resisting GMOs while simultaneously creating alternatives.
Colonial history
The decline of the Ahupua’a system didn’t only set Hawai’i on the path away from food sovereignty; it also destroyed the political independence of the now-U.S. state. And indeed, when protesters chant “aloha ‘āina” at anti-GMO marches, they are alluding to the fact that this fight isn’t only over competing visions of land use and food creation. It’s also a battle for the islands’ political sovereignty.
Historically, foreign corporate interests have repeatedly taken control of Hawai’i — and have exploited and mistreated the land and its people in the process.
“It’s a systemic problem and the GMO issue just happens to be at the forefront of public debate at the moment,” said Keoni Lee of ʻŌiwi TV. “ʻĀina [land] equals that which provides. Provides for who?”
The presence of Monsanto and the other chemical corporations is eerily reminiscent of the business interests that led to the overthrow of the Hawaiian Kingdom. Throughout the 19th century, the Hawaiian Kingdom was recognized as an independent nation. That reality changed in 1893, when a group of American businessmen and sugar planters orchestrated a U.S. Marine’s armed coup d’etat of the Hawaiian Kingdom government.
Five years later, the U.S. apprehended the islands for strategic military use during the Spanish-American War despite local resistance. Even then-President Grover Cleveland called the overthrow a “substantial wrong” and vowed to restore the Hawaiian kingdom. But the economic interests overpowered the political will, and Hawai’i remained a U.S. colony for the following 60 years.
The annexation of Hawai’i profited five sugarcane-manufacturing companies commonly referred to as the Big Five: Alexander & Baldwin, Amfac (American Factors), Castle & Cooke, C. Brewer, and Theo H. Davies. Most of the founders of these companies were missionaries who were actively involved in lobbying for the annexation of the Hawaiian islands in 1898. After the takeover, the Big Five manipulated great political power and influence in what was then considered the “Territory of Hawaii,” gaining unparalleled control of banking, shipping and importing on the island chain. The companies only sponsored white republicans in government, creating an oligarchy that threatened the labor force if it voted against their interests. The companies’ environmental practices, meanwhile, caused air and water pollution and altered the biodiversity of the land.
The current presence of the five-biotech chemical corporations in Hawai’i mirrors the political and economic colonialism of the Big Five in the early 20th century — particularly because Monsanto has become the largest employer on Molokai.
“There is no difference between the “Big Five” that actually ruled Hawai’i in the past,” said Walter Ritte. “Now it’s another “Big Five,” and they’re all chemical companies. So it’s almost like this is the same thing. It’s like déjàvu.”
Rising up
At the opening of this year’s legislative session on January 16, hundreds of farmers, students and residents marched to the state capitol for a rally titled “Idle No More: We the People.” There, agricultural specialist and food sovereignty activist Vandana Shiva, who traveled from India to Hawai’i for the event, addressed the crowd.
“I see Hawai’i not as a place where I come and people say, ‘Monsanto is the biggest employer,’ but people say, ‘this land, its biodiversity, our cultural heritage is our biggest employer,’” she said.
As she alluded to, a major obstacle facing the anti-GMO movement is the perception that the chemical corporations provide jobs that otherwise might not exist — an economic specter that the sugarcane companies also wielded to their advantage. Anti-GMO organizers are aware of how entrenched this power is.
“The things that we’re standing up against are really at the core of capitalism,” proclaimed Hawaiian rights activist Andre Perez at the rally.
Given the enormity of the enemy, anti-GMO activists are attacking the issue from a variety of fronts, including organizing mass education, advocating for non-GMO food sovereignty and pushing for legislative protections. Organizers see education, in particular, as the critical element to win this battle.
“Hawai’i has the cheapest form of democracy,” said Daniel Anthony, a young local activist and founder of a traditional poi business. “Here we can educate a million people, and Monsanto is out.”
Others are using art to educate the public, such as Hawaiian rapper Hood Prince, who rails against Monsanto in his song “Say No to GMO.” This movement is also educating the community through teach-ins and the free distribution of the newly released book Facing Hawaii’s Future: Essential Information about GMOs.
Hawai’i has already succeeded in protecting its traditional food from genetic engineering. Similar to the way the Big Five controlled varying sectors of society, the biotech engineering companies are financially linked to the local government, schools and university. Monsanto partially funds the College of Tropical Agriculture and Human Resources at the University of Hawaii. The university and the Hawaii Agriculture Research Center began the process of genetically engineering taro in 2003 after the university patented three of its varieties. Once this information became widely known, it incited uproar of objection from the Hawaiian community. Taro holds spiritual significance in the islands’ indigenous culture, in which it is honored as the first Hawaiian ancestor in the creation story.
“It felt like we were being violated by the scientific community,” wrote Ritte in Facing Hawaii’s Future. “For the Hawaiian community, taro is not just a plant. It’s a family member. It’s our common ancestor ‘Haloa …. They weren’t satisfied with just taking our land; now they wanted to take our mana, our spirit too.”
The public outcry eventually drove the university to drop its patents.
Anti-GMO activists are hoping for further successes in stopping genetic food engineering. In the current legislative session, there are about a dozen proposed bills pushing GMO regulation, labeling and a ban on all imported GMO produce. These fights over mandating GMO labeling and regulation in Hawai’i may seem like a remote issue, but what happens on these isolated islands is pivotal for land sovereignty movements across the globe.
“These five major chemical companies chose us to be their center,” said Ritte. “So whatever we do is going to impact everybody in the world.”
From Waging Nonviolence: http://wagingnonviolence.org/feature/the-struggle-to-reclaim-paradise/
by Deep Green Resistance News Service | Apr 6, 2013 | Climate Change, Mining & Drilling
By Max Wilbert / Deep Green Resistance Great Basin
While global warming is a topic of conversation and news coverage every day around the world, the basic raw materials that drive the global economy are rarely discussed as being involved. But these materials play a key role in global environmental issues.
Where do plastics come from? How is paint made? How do simple electronics, like land line telephones, come to be? How does the electric grid itself come to be? And in a world that is being wracked by warming, how do these basic industrial technologies impact the climate?
This will be the first article in a series exploring these questions and more. This inaugural piece will focus on steel: a material so ubiquitous it is nearly invisible, a material that was the foundation of the industrial revolution, a material that even today is used a measure for the health of the global economy.
The foundation of an economy
Steel, alongside oil, is the basic raw material of the global industrial economy. The material is widely used in construction and almost all other industries. The amount of steel being consumed per capita is often used as a measure of economic progress: financial firms like the World Bank consider 700 pounds of steel consumption per person per year a basic measure of the economic development of a nation.
More than 1.3 billion tons of steel is produced every year.
What is steel made of?
Steel is an alloy composed mainly of iron mixed with smaller portions other material, most often carbon, but sometimes manganese, chromium, vanadium, or tungsten. These other substances act as hardening agents to strengthen the steel.
The first step in our journey along the path of steel production is the extraction of the basic materials. The largest iron ore mine in the world is the Carajás Mine in Northern Brazil. The facility produces more than 90 million tons of iron ore every year. The ore is transported nearly 900km (in the largest train in the world) along a single train track to the port city of Sao Luis.
The train line, called EFC, was shut down in October of 2012 by indigenous inhabitants of the region protesting a planned expansion of the mine.
The environmental impacts of the mine are numerous. Firstly, to reach the ore, the rainforest must be cleared. More than 6,000 square kilometers of forest around the Carajas mine are clearcut every year for charcoal alone. More forest is removed for direct mining operations. Mercury is used in the mining process, and contaminates 90 percent of fish downstream of the mine.
In addition to the environmental impacts, iron ore mining in the Amazon has displaced tens of thousands of indigenous people, decimated newly-contacted tribes through the spread of infectious diseases, and flooded remote areas with thousands of workers, networks of roads, and all the associated impacts.
Poverty, social conflict, and environmental devastation have been the wages of mining. As the World Wildlife Federation has noted, “Mining is one of the dirtiest industrial activities on the planet, in terms of both its immediate environmental impacts and its CO2 emissions.”
Smelting and steel production
Once the raw materials for steel production are gathered, they must be combined. The first step is the smelting of iron ore in a blast furnace. The heat to melt iron ore usually comes from burning natural gas, coal or, more often coke.
“Coke is the most important raw material fed into the blast furnace in terms of its effect on blast furnace operation and hot metal quality,” writes Hardarshan S. Valia, a scientist at Inland Steel (now ArcelorMittal).
Coking coal is a fuel and heat source that is essential to the production of steel. Coke, also known as metallurgical coal, is produced by baking coal in an airtight furnace at 2,000-3,000 °F. Generally, two tons of coal are baked to create one ton of coke. The process of creating coke toxifies large amounts of water, releases copious greenhouse gases and other toxic fumes, and requires large amounts of electricity.
“Air emissions such as coke oven gas, naphthalene, ammonium compounds, crude light oil, sulfur and coke dust are released from coke ovens,” notes the Illinois Sustainable Technology Center, “[and] quenching water becomes contaminated with coke breezes and other compounds.”
At this stage of the process, ground up limestone or other carbon-rich rock is added to the molten iron ore to balance the acidity of coke and coal. This is called reduction. While a small portion of the carbon content of the limestone and coal or coke is adsorbed into the molten metal and adds strength to the steel, the bulk of this carbon is released to the atmosphere as CO2.
At current rates, around 1.9 metric tons of CO2 are released for every metric ton of steel production. Overall, the International Energy Agency estimates that 4-5% of global CO2 emissions come from the iron and steel industry.
Once the smelting process in the blast furnace is complete, the result is an intermediate stage in steel production called pig iron. This molten pig iron is now prepared for the next step, which involves processing in a basic oxygen furnace.
In the basic oxygen furnace, molten pig iron is poured into a large ladle and scraps of recycled steel are added. Impurities of silicon, phosphorous, and sulfur are removed by means of a chemical reaction, and high purities of oxygen are blown into the vessel at velocities greater than the speed of sound. This superheats the mixture and removes further impurities. The molten metal is now steel.
The basic oxygen furnace is only the most common method of steel production, used for 60% of global production with the process described above. This is called “primary steel production”. Secondary steel, which requires less energy input but is a lower quality product, is made entirely from scrap steel using an electric arc furnace. Steel production from recycled scrap accounts for nearly half of all steel production in developed countries.
What is steel used for?
As noted above, steel is critical to the global economy. It is considered one of the basic raw materials for industrial development, and is used for the production of cranes, ships, trucks, trailers, cars, jacking platforms, underwater cables, electrical transmission towers and lines, rail cars, girders for buildings and bridges, home appliances, pots and pans, bicycles, guard rails, scaffolding - the list goes on endlessly.
While the role of steel and other polluting substances in many of these products and industries has been examined thoroughly, the same rigor has generally not been applied to alternative energy technologies. Wind turbines, for example, use a great deal of steel. As has been noted by the World Steel Association, the global trade group for the industry: “every part of a wind turbine depends on iron and steel.”
Can steel be sustainable?
One of the most common wind turbines in the world today is a 1.5 megawatt design produced by General Electric. The nacelle - the portion of the turbine on top of the tower - weighs 56 tons, while the tower weighs in at 71 tons and the blades at 36 tons. A single turbine, at over 60 percent steel, requires over 100 tons of the material.
This 1.5 megawatt model is a smaller design by modern standards - the latest industrial turbines can require more than twice as much steel.
The production and installation of wind turbines also requires large amounts of concrete (more than 1,000 tons for a standard wind turbine anchor platform) and other materials such as copper, which is used for electrical cables and makes up some 35% of the generator. About half of all copper mined worldwide is used for electrical wires and transmission cables.
Copper production is a large source of pollution and waste, starting with the exploration and development process, where roads and facilities are built, and ending with the toxic byproducts of copper refining.
Impacts of copper mining mirror steel production, and include land clearance, soil removal, erosion of soil and mine waste, toxic tailings, acid mine drainage, contaminant leaching, water extraction and contamination, the release of dust and particulate matter, air pollution from vehicles and machinery, mercury and other heavy metal contamination, habitat loss and fragmentation, soil and groundwater contamination, and greenhouse gas emissions.
The Bingham Canyon Copper Mine near Salt Lake City, Utah, is the largest man-made excavation in the world, and a good example of the toxic nature of extraction and refining – the Salt Lake Valley periodically registers the worst air quality in the United States. The mine is visible from space with the naked eye.
Global Trade
Beyond the direct impacts of steel production, the process of creating wind turbines must be assessed in context; in this case, the context of global trade. Creating a wind turbine is a worldwide manufacturing operation, explains Brian Doughty of Puget Sound Energy, who manages a wind power installation in eastern Washington state.
“For this particular project,” Doughty notes, “these tower sections came from Vietnam, the nacelles and blades came from Denmark, everything was brought into the port of Vancouver WA, and brought up here [to eastern Washington] by truck.”
This global arrangement of shipping and transportation tangles wind turbines further in a vast, deadly net of fossil fuels, pollution, devastated ecosystems, “free trade” agreements, and decimated communities.
Steel: the past, not the future?
The World Steel Association and other global entities are convinced that steel is a key material for the future of civilization. But as should be clear from the information presented above, steel is an industrial material for an industrial world – dirty, polluting, energy intensive.
There are many options for the human species moving forward. Steel lies along the industrial path that we have trodden before, dirty and littered with the bodies of the collaterally damaged. Which path is taken remains to be seen, but one thing is sure: before we can make the right decisions, we must have the facts. And with steel, the facts are grim.
References